Product: Tim23 Antibody
Catalog: DF12052
Description: Rabbit polyclonal antibody to Tim23
Application: WB IHC
Reactivity: Human, Mouse, Rat
Prediction: Zebrafish, Bovine, Horse, Xenopus
Mol.Wt.: 22 kDa; 22kD(Calculated).
Uniprot: O14925
RRID: AB_2844857

View similar products>>

   Size Price Inventory
 100ul $280 In stock
 200ul $350 In stock

Lead Time: Same day delivery

For pricing and ordering contact:
Local distributors

Product Info

Source:
Rabbit
Application:
WB 1:500-1:2000, IHC 1:50-1:200
*The optimal dilutions should be determined by the end user.
*Tips:

WB: For western blot detection of denatured protein samples. IHC: For immunohistochemical detection of paraffin sections (IHC-p) or frozen sections (IHC-f) of tissue samples. IF/ICC: For immunofluorescence detection of cell samples. ELISA(peptide): For ELISA detection of antigenic peptide.

Reactivity:
Human,Mouse,Rat
Prediction:
Zebrafish(92%), Bovine(100%), Horse(100%), Xenopus(92%)
Clonality:
Polyclonal
Specificity:
Tim23 Antibody detects endogenous levels of total Tim23.
RRID:
AB_2844857
Cite Format: Affinity Biosciences Cat# DF12052, RRID:AB_2844857.
Conjugate:
Unconjugated.
Purification:
The antiserum was purified by peptide affinity chromatography using SulfoLink™ Coupling Resin (Thermo Fisher Scientific).
Storage:
Rabbit IgG in phosphate buffered saline , pH 7.4, 150mM NaCl, 0.02% sodium azide and 50% glycerol. Store at -20 °C. Stable for 12 months from date of receipt.
Alias:

Fold/Unfold

MGC22767; MGC93478; Mitochondrial import inner membrane translocase subunit Tim23; Predicted protein of HQ1197; PRO1197; TIM23; TIMM 23; TIMM23; Translocase of inner mitochondrial membrane 23 (yeast) homolog; Translocase of inner mitochondrial membrane 23 homolog (yeast); Translocase of inner mitochondrial membrane 23 homolog B; Translocation of mitochondrial precursor proteins;

Immunogens

Immunogen:
Uniprot:
Gene(ID):
Sequence:
MEGGGGSGNKTTGGLAGFFGAGGAGYSHADLAGVPLTGMNPLSPYLNVDPRYLVQDTDEFILPTGANKTRGRFELAFFTIGGCCMTGAAFGAMNGLRLGLKETQNMAWSKPRNVQILNMVTRQGALWANTLGSLALLYSAFGVIIEKTRGAEDDLNTVAAGTMTGMLYKCTGGLRGIARGGLTGLTLTSLYALYNNWEHMKGSLLQQSL

Predictions

Predictions:

Score>80(red) has high confidence and is suggested to be used for WB detection. *The prediction model is mainly based on the alignment of immunogen sequences, the results are for reference only, not as the basis of quality assurance.

Species
Results
Score
Horse
100
Bovine
100
Xenopus
92
Zebrafish
92
Pig
0
Sheep
0
Dog
0
Chicken
0
Rabbit
0
Model Confidence:
High(score>80) Medium(80>score>50) Low(score<50) No confidence

PTMs - O14925 As Substrate

Site PTM Type Enzyme
M1 Acetylation
K68 Ubiquitination
K101 Ubiquitination
T164 Phosphorylation
Y168 Phosphorylation

Research Backgrounds

Function:

Essential component of the TIM23 complex, a complex that mediates the translocation of transit peptide-containing proteins across the mitochondrial inner membrane.

Subcellular Location:

Mitochondrion inner membrane>Multi-pass membrane protein.

Extracellular region or secreted Cytosol Plasma membrane Cytoskeleton Lysosome Endosome Peroxisome ER Golgi apparatus Nucleus Mitochondrion Manual annotation Automatic computational assertionSubcellular location
Subunit Structure:

Component of the TIM23 complex at least composed of TIMM23, TIMM17 (TIMM17A or TIMM17B) and TIMM50; within this complex, directly interacts with TIMM50. The complex interacts with the TIMM44 component of the PAM complex and with DNAJC15.

Family&Domains:

Belongs to the Tim17/Tim22/Tim23 family.

References

1). SARS-CoV-2 ORF3a induces RETREG1/FAM134B-dependent reticulophagy and triggers sequential ER stress and inflammatory responses during SARS-CoV-2 infection. Autophagy (PubMed: 35239449) [IF=13.3]

2). Morphine-induced microglial immunosuppression via activation of insufficient mitophagy regulated by NLRX1. Journal of Neuroinflammation (PubMed: 35414088) [IF=9.3]

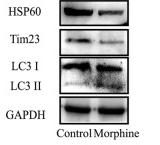
Application: WB    Species: Mice    Sample: BV2 cells

Fig. 1 Morphine induced NLRX1-mediated mitophagy in microglia. A The mitochondrial DNA (mtDNA) levels were decreased significantly in primary microglia with 1.0 μM morphine as measured by mtDNA/nDNA analysis (n = 4). B Co-staining of HSP60 or Tim23 and LC3B in primary microglia. Bar = 10 μm. C The quantified results of AD-mCherry-GFP-LC3B transfection in BV2 cells with morphine treatment (n > 50 cells). The Kruskal–Wallis test was employed to indicate statistical significance. The results of mCherry-dots are shown in red and the mCherry-GFP-dots are shown in yellow. D Representative Western blots of BV2 cells in control or morphine treatment group (n = 3–6). E The expression of NLRX1 mRNA was peaked in primary microglia with 1.0 μM morphine as measured by qPCR (n = 3). One-way ANOVA were employed in A, E. F Quantitative graphs of NLRX1 mRNA in BV2 cells (n = 6). G, H Confocal microscopy analysis of NLRX1 (red), LC3B (green) and DAPI (light blue). Bar = 2 μm. The Pearson’s correlation coefficients of NLRX1 and LC3B were elevated in morphine-treated BV2 cells (H, n = 6–9 fields). I Co-immunoprecipitation analysis of NLRX1 and LC3 in BV2 cells (n = 3). J, K Western blots analysis of NLRX1-mediated mitophagy in BV2 cells by siRNA (J, n = 5) or shRNA (K, n = 3). L The quantified results of AD-mCherry-GFP-LC3B transfection in BV2 cells with NC-siRNA or NLRX1-siRNA pre-treatment (n > 50 cells). Data represent the mean ± SEM. Student's t-test or Mann–Whitney U test were used to measure significance between two groups. (* p < 0.05, ** p < 0.01, *** p < 0.001 and ns p > 0.05)

Application: IF/ICC    Species: Mice    Sample: primary astrocyte

Fig. 2 NLRX1-mediated mitophagy occurred in microglia independent of PINK1–Parkin pathway, but not astrocyte (A, B) Quantitative graphs of NLRX1 mRNA (A, n = 6) and representative Western blots of mitophagy (B, n = 3) in primary astrocyte. Quantitative graphs of NLRX1 mRNA (C, n = 6) and representative Western blots of mitophagy (D, n = 3) in MA cells. E Co-staining of HSP60 or Tim23 and LC3B in primary astrocyte. Bar = 10 μm. F The quantitative graphs of JC-1 assays as measured by flow cytometry (n = 4). G The NLRX1 mRNA expression of BV2 cells with or without CCCP treatment (n = 6). Data represent the mean ± SEM. Two-sided Student’s t tests were used to measure significance between two groups (* p < 0.05, ** p < 0.01, *** p < 0.001 and ns p > 0.05)

3). Germacrone protects renal tubular cells against ferroptotic death and ROS release by re-activating mitophagy in diabetic nephropathy. Free radical research (PubMed: 37897414) [IF=3.3]

Restrictive clause


Affinity Biosciences tests all products strictly. Citations are provided as a resource for additional applications that have not been validated by Affinity Biosciences. Please choose the appropriate format for each application and consult Materials and Methods sections for additional details about the use of any product in these publications.

For Research Use Only.
Not for use in diagnostic or therapeutic procedures. Not for resale. Not for distribution without written consent. Affinity Biosciences will not be held responsible for patent infringement or other violations that may occur with the use of our products. Affinity Biosciences, Affinity Biosciences Logo and all other trademarks are the property of Affinity Biosciences LTD.