Product: Cyclin B1 Antibody
Catalog: AF6168
Description: Rabbit polyclonal antibody to Cyclin B1
Application: WB IHC IF/ICC
Reactivity: Human, Mouse, Rat
Prediction: Bovine, Horse, Sheep, Rabbit, Dog
Mol.Wt.: 60kDa; 48kD(Calculated).
Uniprot: P14635
RRID: AB_2835034

View similar products>>

   Size Price Inventory
 100ul $280 In stock
 200ul $350 In stock

Lead Time: Same day delivery

For pricing and ordering contact:
Local distributors

Product Info

Source:
Rabbit
Application:
WB 1:500-1:2000, IHC 1:50-1:200, IF/ICC 1:100-1:500
*The optimal dilutions should be determined by the end user.
*Tips:

WB: For western blot detection of denatured protein samples. IHC: For immunohistochemical detection of paraffin sections (IHC-p) or frozen sections (IHC-f) of tissue samples. IF/ICC: For immunofluorescence detection of cell samples. ELISA(peptide): For ELISA detection of antigenic peptide.

Reactivity:
Human,Mouse,Rat
Prediction:
Bovine(91%), Horse(91%), Sheep(91%), Rabbit(91%), Dog(91%)
Clonality:
Polyclonal
Specificity:
Cyclin B1 Antibody detects endogenous levels of total Cyclin B1.
RRID:
AB_2835034
Cite Format: Affinity Biosciences Cat# AF6168, RRID:AB_2835034.
Conjugate:
Unconjugated.
Purification:
The antiserum was purified by peptide affinity chromatography using SulfoLink™ Coupling Resin (Thermo Fisher Scientific).
Storage:
Rabbit IgG in phosphate buffered saline , pH 7.4, 150mM NaCl, 0.02% sodium azide and 50% glycerol. Store at -20 °C. Stable for 12 months from date of receipt.
Alias:

Fold/Unfold

CCNB 1; CCNB; ccnb1; CCNB1_HUMAN; Cyclin B1; G2 mitotic specific cyclin B1; G2/mitotic-specific cyclin-B1;

Immunogens

Immunogen:
Uniprot:
Gene(ID):
Description:
a member of the highly conserved cyclin family, whose members are characterized by a dramatic periodicity in protein abundance through the cell cycle. Cyclins function as regulators of CDK kinases.
Sequence:
MALRVTRNSKINAENKAKINMAGAKRVPTAPAATSKPGLRPRTALGDIGNKVSEQLQAKMPMKKEAKPSATGKVIDKKLPKPLEKVPMLVPVPVSEPVPEPEPEPEPEPVKEEKLSPEPILVDTASPSPMETSGCAPAEEDLCQAFSDVILAVNDVDAEDGADPNLCSEYVKDIYAYLRQLEEEQAVRPKYLLGREVTGNMRAILIDWLVQVQMKFRLLQETMYMTVSIIDRFMQNNCVPKKMLQLVGVTAMFIASKYEEMYPPEIGDFAFVTDNTYTKHQIRQMEMKILRALNFGLGRPLPLHFLRRASKIGEVDVEQHTLAKYLMELTMLDYDMVHFPPSQIAAGAFCLALKILDNGEWTPTLQHYLSYTEESLLPVMQHLAKNVVMVNQGLTKHMTVKNKYATSKHAKISTLPQLNSALVQDLAKAVAKV

Predictions

Predictions:

Score>80(red) has high confidence and is suggested to be used for WB detection. *The prediction model is mainly based on the alignment of immunogen sequences, the results are for reference only, not as the basis of quality assurance.

Species
Results
Score
Horse
91
Bovine
91
Sheep
91
Dog
91
Rabbit
91
Xenopus
67
Pig
0
Zebrafish
0
Chicken
0
Model Confidence:
High(score>80) Medium(80>score>50) Low(score<50) No confidence

PTMs - P14635 As Substrate

Site PTM Type Enzyme
T6 Phosphorylation
S9 Phosphorylation
K25 Acetylation
K25 Ubiquitination
S35 Phosphorylation
K36 Ubiquitination
K51 Ubiquitination
S69 Phosphorylation
K73 Acetylation
S95 Phosphorylation
K111 Sumoylation
S116 Phosphorylation
S126 Phosphorylation P06493 (CDK1) , P28482 (MAPK1) , P53350 (PLK1)
S128 Phosphorylation P06493 (CDK1) , P53350 (PLK1) , P28482 (MAPK1)
S133 Phosphorylation P53350 (PLK1) , Q9H4B4 (PLK3)
S147 Phosphorylation P53350 (PLK1)
Y177 Phosphorylation
K190 Ubiquitination
K279 Ubiquitination
K311 Ubiquitination
T321 Phosphorylation
T362 Phosphorylation
T395 Phosphorylation
K396 Ubiquitination
K411 Ubiquitination
S413 Phosphorylation
K428 Ubiquitination

PTMs - P14635 As Enzyme

Substrate Site Source
Q06413-1 (MEF2C) S396 Uniprot
Q92993-1 (KAT5) S86 Uniprot
Q92993-2 (KAT5) S90 Uniprot
Q92993-3 (KAT5) S119 Uniprot
Q92993-3 (KAT5) S123 Uniprot
Q96KB5-1 (PBK) T9 Uniprot

Research Backgrounds

Function:

Essential for the control of the cell cycle at the G2/M (mitosis) transition.

PTMs:

Ubiquitinated by the SCF(NIPA) complex during interphase, leading to its destruction. Not ubiquitinated during G2/M phases.

Phosphorylated by PLK1 at Ser-133 on centrosomes during prophase: phosphorylation by PLK1 does not cause nuclear import. Phosphorylation at Ser-147 was also reported to be mediated by PLK1 but Ser-133 seems to be the primary phosphorylation site.

Subcellular Location:

Cytoplasm. Nucleus. Cytoplasm>Cytoskeleton>Microtubule organizing center>Centrosome.

Extracellular region or secreted Cytosol Plasma membrane Cytoskeleton Lysosome Endosome Peroxisome ER Golgi apparatus Nucleus Mitochondrion Manual annotation Automatic computational assertionSubcellular location
Subunit Structure:

Interacts with the CDC2 protein kinase to form a serine/threonine kinase holoenzyme complex also known as maturation promoting factor (MPF). The cyclin subunit imparts substrate specificity to the complex. Binds HEI10. Interacts with catalytically active RALBP1 and CDC2 during mitosis to form an endocytotic complex during interphase. Interacts with CCNF; interaction is required for nuclear localization. Interacts with CDK5RAP3. Interacts with RFPL4A and UBE2A (By similarity). Interacts with INCA1.

Family&Domains:

Belongs to the cyclin family. Cyclin AB subfamily.

Research Fields

· Cellular Processes > Cell growth and death > Cell cycle.   (View pathway)

· Cellular Processes > Cell growth and death > Oocyte meiosis.   (View pathway)

· Cellular Processes > Cell growth and death > p53 signaling pathway.   (View pathway)

· Cellular Processes > Cell growth and death > Cellular senescence.   (View pathway)

· Environmental Information Processing > Signal transduction > FoxO signaling pathway.   (View pathway)

· Organismal Systems > Endocrine system > Progesterone-mediated oocyte maturation.

References

1). Secalonic acid D induces cell apoptosis in both sensitive and ABCG2-overexpressing multidrug resistant cancer cells through upregulating c-Jun expression. Acta Pharmaceutica Sinica B (PubMed: 31193763) [IF=14.5]

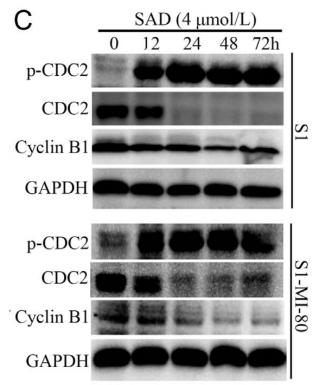
Application: WB    Species: human    Sample: S1 and S1-MI-80 cells

Figure 2 | Effect of SAD on cell cycle and apoptosis. (A) The cell cycle analysis was determined by PI staining and flow cytometry cell quest software. S1 and S1-MI-80 cells were treated with 4 μmol/L SAD for 12, 24, 48, and 72 h, respectively. The content of G2/M phase was increased in a time-dependent pattern. (B) Histograms of cell cycle distribution in non-treated and treated S1 and S1-MI-80 cells. (C) S1 and S1-MI-80 cells were treated with SAD (4 μmol/L) for four different time points. Western blot analysis was used to detect the levels of CDC2, p-CDC2 and cyclin B1 protein after SAD treatment.

2). Interfering with hyaluronic acid metabolism suppresses glioma cell proliferation by regulating autophagy. Cell Death & Disease (PubMed: 33986244) [IF=9.0]

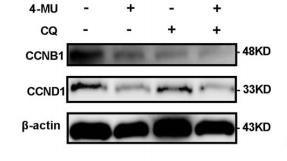
Application: WB    Species: human    Sample: U251 glioma cells

Fig. 7| 4-MU inhibits glioma growth in vivo and, when combined with autophagy inhibitors, exerts synergistic effects on glioma cell viability, autophagy levels, and the cell cycle. Relative levels of the CCNB1 and CCND1 proteins in U251 glioma cells cultured with 4-MU, followed by treatment with CQ (30 μmol/L) for 48 h.

3). Ganoderma lucidum polysaccharide inhibits HSC activation and liver fibrosis via targeting inflammation, apoptosis, cell cycle, and ECM-receptor interaction mediated by TGF-β/Smad signaling. Phytomedicine (PubMed: 36603342) [IF=7.9]

4). Silica nanoparticles cause spermatogenesis dysfunction in mice via inducing cell cycle arrest and apoptosis. ECOTOXICOLOGY AND ENVIRONMENTAL SAFETY (PubMed: 35051769) [IF=6.8]

5). Silibinin Induces G2/M Cell Cycle Arrest by Activating Drp1-Dependent Mitochondrial Fission in Cervical Cancer. Frontiers in Pharmacology (PubMed: 32226384) [IF=5.6]

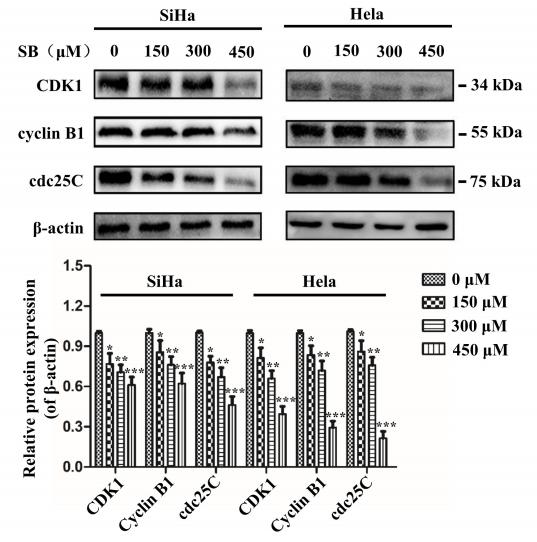
Application: WB    Species: human    Sample: cervical cancer cells

FIGURE 3 | SB induces G2/M cell cycle arrest in cervical cancer cells. (A) A marked dose-dependent increase of the percentage of cervical cancer cells in the G2/M phase arrest by flow cytometry. (B) The protein expression levels of CDK1, cyclin B1, and cdc25C at 24 h after SB treatment. Expression levels were normalized to the β-actin protein level. Values (mean ± SDs) were obtained from at least three independent experiments. *P < 0.05, **P < 0.01, and ***P < 0.001 by one-way ANOVA with Tukey’s test

6). Effects of metformin on Sonic hedgehog subgroup medulloblastoma progression: In vitro and in vivo studies. Frontiers in Pharmacology (PubMed: 36278239) [IF=5.6]

7). SLC35A2 expression drives breast cancer progression via ERK pathway activation. The FEBS journal (PubMed: 38143314) [IF=5.4]

8). Cyclovirobuxine D inhibits growth and progression of non‑small cell lung cancer cells by suppressing the KIF11‑CDC25C‑CDK1‑CyclinB1 G2/M phase transition regulatory network and the NFκB/JNK signaling pathway. International Journal of Oncology (PubMed: 36929198) [IF=5.2]

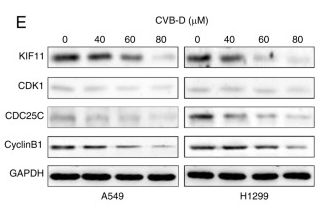
Application: WB    Species: Human    Sample: NSCLC cells

Figure 6 KIF11, KIF11-CDK1-CDC25C-cyclinB1 oncogenic network and NF-kB/JNK signaling pathway are the potential CVB-D therapeutic targets in the NSCLC cells. (A) Venn diagram showed the overlap number of potential CVB-D target genes in NSCLC cells by intersecting four LUAD datasets. (B) Protein-protein interaction network analysis revealed interaction between the 10 overlapping DEGs. The disconnected nodes are hidden. (C) The interactive heatmap from GEPIA 2 database showed expression of the 6 DEGs in LUAD and normal lung tissues. KIF11 is the most differentially expressed gene between LUAD and normal lung tissues. (D) Venn diagram revealed 2 common genes (KIF11 and CDK1) based on intersection between the 10 overlapping DEGs and the 100 predicted CVB-D target genes extracted from the Swisstarget prediction database. (E) Western blot analysis identified the expression of KIF11, CDK1, CDC25C and cyclinB1 proteins in the control and CVB-D-treated NSCLC cells. (F and G) Immunohistochemical assay results showed the expression levels and localization of the KIF11 protein in the control and CVB-D-treated A549 xenograft tumor tissues. (H) Western blot assay results revealed the KIF11 protein levels in the si-NC and si-KIF11-transfected NSCLC cells. (I) Western blot analysis demonstrated the expression levels of the oncogenic signaling network proteins (KIF11, CDK1, CDC25C and CyclinB1) and the NF-κB/JNK signaling pathway proteins (p65, p-p65, JNK and p-JNK) in the si-NC- and si-KIF11-transfected NSCLC cells. **P

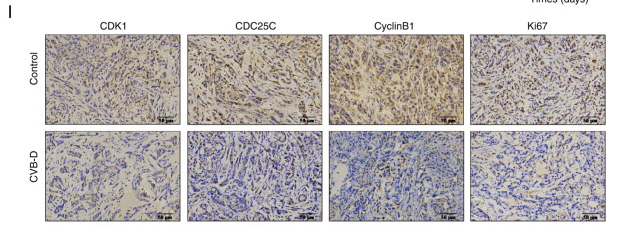
Application: IHC    Species: Mouse    Sample: A549 cells

Figure 7 CVB-D inhibits in vivo progression of A549 xenografts tumors. (A) Experimental design for tumor xenograft experiments of NSCLC in nude mice to evaluate the in vivo therapeutic effects of CVB-D. Specific time points for CVB-D treatment and experimental analysis are indicated. (B) Representative images of the NSCLC xenograft tumor models with or without CVB-D treatment. (C) Representative images of the NSCLC xenograft tumor tissues from control and CVB-D-treated mice. (D and E) NSCLC xenograft tumor weights and volumes in the control and CVB-D treatment groups of nude mice. (F) Representative H&E and TUNEL staining images of the A549 xenograft tumor sections in the control and CVB-D treatment groups of nude mice (magnification, ×200; scale bar, 50 µm). (G) The proportion of apoptotic cells in the A549 xenograft tumors derived from the control and CVB-D-treatment groups of nude mice based on TUNEL staining. (H) The body weights of the xenograft tumor model mice in the control and CVB-D treatment groups. (I and J) Immunohistochemical assay data revealed the expression levels and distribution of CDK1, CDC25C, cyclinB1, Ki67, Bcl-2 and N-cadherin proteins in the A549 xenograft tumors derived from the control and CVB-D treatment groups (magnification, ×200; scale bar, 50 µm). *P

9). Ovostatin 2 knockdown significantly inhibits the growth, migration, and tumorigenicity of cutaneous malignant melanoma cells. PLoS One (PubMed: 29684087) [IF=3.7]

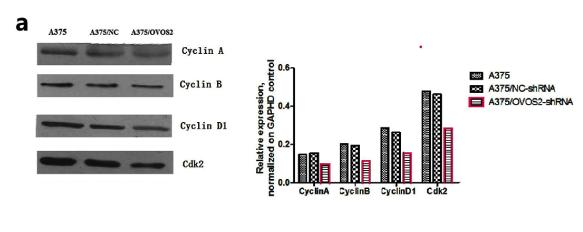
Application: WB    Species: mouse    Sample: A375 cells

Fig 5. |Western blot results. (a) The levels of cyclin A, cyclin B, cyclin D1, and CDK2 were reduced in A375 cells transfected with OVOS2-shRNA

10). Regulation of the PTEN/PI3K/AKT pathway in RCC using the active compounds of natural products in vitro. Molecular Medicine Reports (PubMed: 34490473) [IF=3.4]

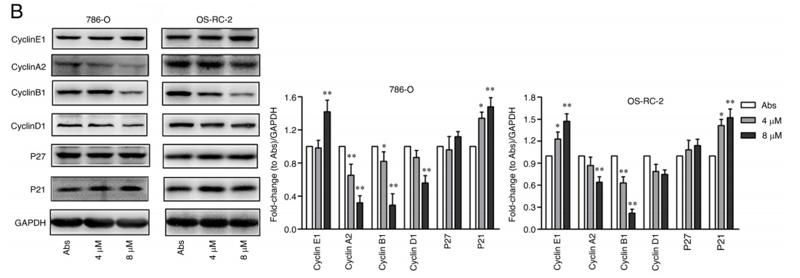
Application: WB    Species: human    Sample: 786‑O and OS‑RC‑2 cells

Figure 3.| Naringenin arrests cell cycle progression of renal cell carcinoma cells in the G2 phase. 786‑O and OS‑RC‑2 cells were treated with naringenin (0, 4 or 8 µM) for 48 h. (A) Cell cycle distribution was determined using flow cytometry. (B) Western blot analysis of cyclin E1, cyclin A2, cyclin B1, cyclin D1, P27 and P21 expression levels. Data are presented as the mean ± SD. * P<0.05, **P<0.01 vs. Abs. Abs, absolute ethanol.

Load more

Restrictive clause


Affinity Biosciences tests all products strictly. Citations are provided as a resource for additional applications that have not been validated by Affinity Biosciences. Please choose the appropriate format for each application and consult Materials and Methods sections for additional details about the use of any product in these publications.

For Research Use Only.
Not for use in diagnostic or therapeutic procedures. Not for resale. Not for distribution without written consent. Affinity Biosciences will not be held responsible for patent infringement or other violations that may occur with the use of our products. Affinity Biosciences, Affinity Biosciences Logo and all other trademarks are the property of Affinity Biosciences LTD.