Product: GABA A Receptor beta 1 Antibody
Catalog: AF6207
Description: Rabbit polyclonal antibody to GABA A Receptor beta 1
Application: WB IHC IF/ICC
Reactivity: Human, Mouse, Rat, Monkey
Prediction: Pig, Zebrafish, Bovine, Horse, Rabbit, Dog
Mol.Wt.: 54kDa; 54kD(Calculated).
Uniprot: P18505
RRID: AB_2835088

View similar products>>

   Size Price Inventory
 100ul $280 In stock
 200ul $350 In stock

Lead Time: Same day delivery

For pricing and ordering contact:
Local distributors

Product Info

Source:
Rabbit
Application:
WB 1:500-1:2000, IHC 1:50-1:200, IF/ICC 1:100-1:500
*The optimal dilutions should be determined by the end user.
*Tips:

WB: For western blot detection of denatured protein samples. IHC: For immunohistochemical detection of paraffin sections (IHC-p) or frozen sections (IHC-f) of tissue samples. IF/ICC: For immunofluorescence detection of cell samples. ELISA(peptide): For ELISA detection of antigenic peptide.

Reactivity:
Human,Mouse,Rat,Monkey
Prediction:
Pig(100%), Zebrafish(82%), Bovine(100%), Horse(100%), Rabbit(100%), Dog(100%)
Clonality:
Polyclonal
Specificity:
GABA A Receptor beta 1 Antibody detects endogenous levels of total GABA A Receptor beta 1.
RRID:
AB_2835088
Cite Format: Affinity Biosciences Cat# AF6207, RRID:AB_2835088.
Conjugate:
Unconjugated.
Purification:
The antiserum was purified by peptide affinity chromatography using SulfoLink™ Coupling Resin (Thermo Fisher Scientific).
Storage:
Rabbit IgG in phosphate buffered saline , pH 7.4, 150mM NaCl, 0.02% sodium azide and 50% glycerol. Store at -20 °C. Stable for 12 months from date of receipt.
Alias:

Fold/Unfold

AW061132; B230208N19Rik; GABA(A) receptor beta 1; GABA(A) receptor subunit beta-1; GABA-A receptor, beta-1 polypeptide; Gabrb-1; GABRB1; Gamma aminobutyric acid (GABA) A receptor beta 1; Gamma Aminobutyric Acid A Receptor Beta 1; Gamma Aminobutyric Acid Receptor , beta-1; Gamma-aminobutyric acid (GABA) A receptor, subunit beta 1; Gamma-aminobutyric acid receptor subunit beta-1; GARB1; GBRB1_HUMAN;

Immunogens

Immunogen:
Uniprot:
Gene(ID):
Description:
GABRB1 GABA, the major inhibitory neurotransmitter in the vertebrate brain, mediates neuronal inhibition by binding to the GABA/benzodiazepine receptor and opening an integral chloride channel.
Sequence:
MWTVQNRESLGLLSFPVMITMVCCAHSTNEPSNMSYVKETVDRLLKGYDIRLRPDFGGPPVDVGMRIDVASIDMVSEVNMDYTLTMYFQQSWKDKRLSYSGIPLNLTLDNRVADQLWVPDTYFLNDKKSFVHGVTVKNRMIRLHPDGTVLYGLRITTTAACMMDLRRYPLDEQNCTLEIESYGYTTDDIEFYWNGGEGAVTGVNKIELPQFSIVDYKMVSKKVEFTTGAYPRLSLSFRLKRNIGYFILQTYMPSTLITILSWVSFWINYDASAARVALGITTVLTMTTISTHLRETLPKIPYVKAIDIYLMGCFVFVFLALLEYAFVNYIFFGKGPQKKGASKQDQSANEKNKLEMNKVQVDAHGNILLSTLEIRNETSGSEVLTSVSDPKATMYSYDSASIQYRKPLSSREAYGRALDRHGVPSKGRIRRRASQLKVKIPDLTDVNSIDKWSRMFFPITFSLFNVVYWLYYVH

Predictions

Predictions:

Score>80(red) has high confidence and is suggested to be used for WB detection. *The prediction model is mainly based on the alignment of immunogen sequences, the results are for reference only, not as the basis of quality assurance.

Species
Results
Score
Pig
100
Horse
100
Bovine
100
Dog
100
Rabbit
100
Zebrafish
82
Sheep
0
Xenopus
0
Chicken
0
Model Confidence:
High(score>80) Medium(80>score>50) Low(score<50) No confidence

PTMs - P18505 As Substrate

Site PTM Type Enzyme
K46 Ubiquitination
T85 Phosphorylation
K127 Ubiquitination
K128 Ubiquitination
K137 Ubiquitination
Y309 Phosphorylation
Y324 Phosphorylation
S409 Phosphorylation
S434 Phosphorylation P17612 (PRKACA)
S448 Phosphorylation

Research Backgrounds

Function:

Component of the heteropentameric receptor for GABA, the major inhibitory neurotransmitter in the vertebrate brain. Functions also as histamine receptor and mediates cellular responses to histamine. Functions as receptor for diazepines and various anesthetics, such as pentobarbital; these are bound at a separate allosteric effector binding site. Functions as ligand-gated chloride channel.

Subcellular Location:

Cell junction>Synapse>Postsynaptic cell membrane>Multi-pass membrane protein. Cell membrane>Multi-pass membrane protein.

Extracellular region or secreted Cytosol Plasma membrane Cytoskeleton Lysosome Endosome Peroxisome ER Golgi apparatus Nucleus Mitochondrion Manual annotation Automatic computational assertionSubcellular location
Subunit Structure:

Binds UBQLN1 (By similarity). Heteropentamer, formed by a combination of alpha, beta, gamma, delta and rho chains. Interacts with KCTD8, KCTD12 and KCTD16; this interaction determines the pharmacology and kinetics of the receptor response, the KCTD proteins markedly accelerating the GABA-B response, although to different extents (By similarity).

Family&Domains:

Belongs to the ligand-gated ion channel (TC 1.A.9) family. Gamma-aminobutyric acid receptor (TC 1.A.9.5) subfamily. GABRB1 sub-subfamily.

Research Fields

· Environmental Information Processing > Signaling molecules and interaction > Neuroactive ligand-receptor interaction.

· Human Diseases > Substance dependence > Morphine addiction.

· Organismal Systems > Nervous system > Retrograde endocannabinoid signaling.   (View pathway)

· Organismal Systems > Nervous system > Serotonergic synapse.

· Organismal Systems > Nervous system > GABAergic synapse.

References

1). Metabolic regulation of Ganoderma lucidum extracts in high sugar and fat diet-induced obese mice by regulating the gut-brain axis. Journal of Functional Foods [IF=5.6]

2). Bilirubin Induces Pain Desensitization in Cholestasis by Activating 5-Hydroxytryptamine 3A Receptor in Spinal Cord. Frontiers in Cell and Developmental Biology (PubMed: 33869168) [IF=5.5]

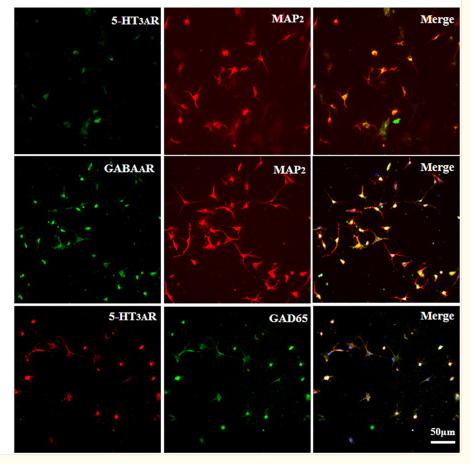
Application: IF/ICC    Species: Rat    Sample: cholestasis rats

FIGURE 5 The 5-HT3A receptor regulated pain thresholds through GABA pathway in cholestasis rats. (A) In normal rats, bicuculline reduced mechanical threshold significantly by intrathecal injection 30 min later. (B) In BDL rats, both ondansetron and bicuculline reversed the increased pain thresholds. (C) Comparison of inhibition ratios among three antagonists. Results showed that ondansetron exerted stronger inhibition ratio than bicuculline and CGP55845 in BDL rats. (D) Both ondansetron and bicuculline, but not CGP55845, could reverse the up-regulation of pain threshold induced by mCPBG in normal rats. (E) Ondansetron, bicuculline, and CGP55845 could reverse the effect induced by intrathecally administrating bilirubin in normal rats. (F) Expression of the 5-HT3A receptor on GABAergic neurons in cultured SDHNs. Most of the cultured neurons (MAP2 is regarded as neuron marker) expressed the 5-HT3A receptor and GAD65 (marker of GABAergic neuron). The merged images showed co-expression of the 5-HT3A receptor and GAD65, suggesting that the majority of GABAergic neurons expressed the 5-HT3A receptor in SDH. *P < 0.05.

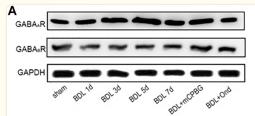
Application: WB    Species: Rat    Sample: spinal cords

FIGURE 6 Bilirubin increased GABAA receptor expression, GABA concentration, and GABAergic sIPSC in spinal cords. (A) GABAA receptor expression increased gradually in the spinal cord enlargement of BDL rats without changing GABAB receptor expression, and ondansetron reduced GABAA receptor expression. (B) The quantitative analysis of GABAA receptor expression in the BDL rats. (C) Intrathecal administration of bilirubin increased GABAA receptor expression, and co-administration of bilirubin and ondansetron decreased it without changing GABAB receptor expression. (D) The quantitative analysis of GABAA receptor expression after intrathecal administration of bilirubin in normal rats. (E) SDHNs cultured with bilirubin showed increased GABAA receptor expression without changing GABAB receptor expression, ondansetron reversed GABAA receptor expression. (F) The quantitative analysis of GABAA receptor expression in SDHNs. (G) GABA concentration in CSF of BDL group was significantly higher than sham group, and ondansetron intervention reversed this change. (H) Intrathecal administration of bilirubin (1000 μM) increased GABA concentration in CSF significantly, whereas ondansetron could reverse it. *P < 0.05.

3). Neurobehavioral alternations of the female offspring born to polycystic ovary syndrome model rats administered by Chinese herbal medicine. Chinese Medicine (PubMed: 34600579) [IF=4.9]

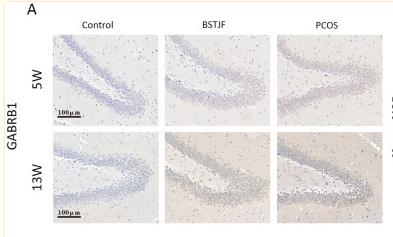
Application: IHC    Species: Human    Sample: ovarian granulosa cells

Fig. 12 Gabrb1 (A), Grin2b (B) and Adra1b (C) protein expression levels in the dentate gyrus of the female offspring of PCOS, BSTJF and controls, as assessed by immunohistochemical staining. The scale bars are 100 μm. The bar plot shows the mean integrated optical density (IOD) (n = 4 in each group at 5 w and 13 w). Data were presented as the mean ± SEM. One-way ANOVA for multiple comparisons and LSD test for pairwise comparisons between groups. (*P < 0.05, #P < 0.01)

Application: WB    Species: Human    Sample: hippocampus tissue

Fig. 13 Gabrb1, Grin2b and Adra1b protein expression levels in the hippocampus of 5 w (A) and 13 w (B) female offspring of PCOS, BSTJF and control groups, as assessed by Western Blotting. The bar plot shows the relative density of gray values of the target protein strips (n = 3 in each group at 5 w and 13 w). Data were presented as the mean ± SEM. Non-parametric test for multiple comparisons and pairwise comparisons between groups. (*P < 0.05)

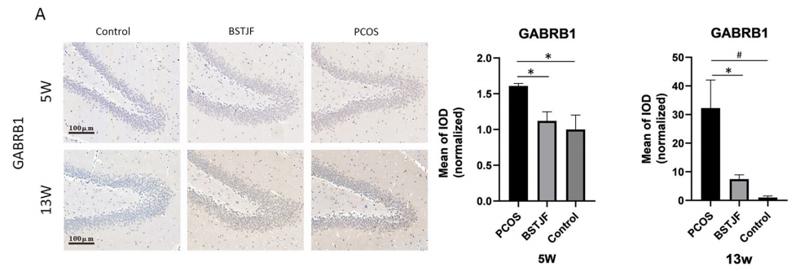
Application: IHC    Species: rat    Sample: dentate gyrus

Fig. 12 | Gabrb1 (A), Grin2b (B) and Adra1b (C) protein expression levels in the dentate gyrus of the female ofspring of PCOS, BSTJF and controls, as assessed by immunohistochemical staining. The scale bars are 100 μm. The bar plot shows the mean integrated optical density (IOD) (n=4 in each group at 5 w and 13 w). Data were presented as the mean±SEM. One-way ANOVA for multiple comparisons and LSD test for pairwise comparisons between groups.

Application: WB    Species: rat    Sample: hippocampus

Fig. 13 | Gabrb1, Grin2b and Adra1b protein expression levels in the hippocampus of 5 w (A) and 13 w (B) female ofspring of PCOS, BSTJF and control groups, as assessed by Western Blotting. The bar plot shows the relative density of gray values of the target protein strips (n=3 in each group at 5 w and 13 w). Data were presented as the mean±SEM. Non-parametric test for multiple comparisons and pairwise comparisons between groups.

4). Intake of flavonoids from Astragalus membranaceus ameliorated brain impairment in diabetic mice via modulating brain-gut axis. Chinese Medicine (PubMed: 35151348) [IF=4.9]

Application: WB    Species: Mice    Sample: brain tissues

Fig. 6 TFA ameliorated intestine barrier and decreased inflammation in high fat diet/STZ induced diabetic mice. A H&E staining of intestine tissue. B Occludin expression tested by immunohistochemistry. C Western Blot of proteins in intestine tissue. D MTT assay of CaCO2 cells viability under LPS or TFA treatment. Proteins expression assay of E ZO-1, F Occludin, and G Claudin 5 of CaCO2 cells under LPS treatment by immunofluorescence. Influence of TFA on the expression of H ZO-1, I Occludin, and J Claudin 5. K and L Protein fluorescence density analysis of for H-J by Image J. m Influence of TFA on the in vitro gut barrier model. The concentration of N IL-6, O TNF-α, P IL-1β, Q LPS, and R 5-HT in serum determined by ELISA. S Expression of GLP-1 and GABA in gut tested by immunohistochemistry (GLP-1 indicated by red arrow). LPS: Lipopolysaccharide. *p < 0.05, **p < 0.01, vs. NC group or vehicle group; #p < 0.05, ##p < 0.01, vs. T2DM group or LPS group

Restrictive clause


Affinity Biosciences tests all products strictly. Citations are provided as a resource for additional applications that have not been validated by Affinity Biosciences. Please choose the appropriate format for each application and consult Materials and Methods sections for additional details about the use of any product in these publications.

For Research Use Only.
Not for use in diagnostic or therapeutic procedures. Not for resale. Not for distribution without written consent. Affinity Biosciences will not be held responsible for patent infringement or other violations that may occur with the use of our products. Affinity Biosciences, Affinity Biosciences Logo and all other trademarks are the property of Affinity Biosciences LTD.