

.
Bands result from membrane strip incubation.")
.
Bands result from membrane strip incubation.")


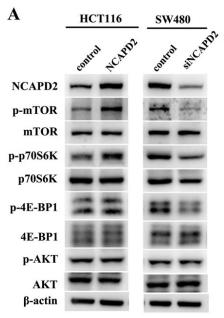
. A, B, Representative Western blot for mTOR, p-mTOR, p70S6K, p-p70S6K, raptor, rictor, AMPKa, p- AMPKa, Akt, and p-Akt.")
 BLM-PPF
cells were treated with RG (2 µM, 4 µM) for 24 h, and the expression levels of autophagy-related proteins (Atg3, Atg7,
p62, and LC3-II/I) were detected. Densitometric analysis are shown beside; (B) Mlg cells were exposed to chloroquine
(CQ) and/or RG (2 µM, 4 µM) for 24 h, and Western blot technology was used to detect the p62 protein expression level;
(C) Mlg cells were exposed to bafilomycin A1 (Baf A1) and/or RG (2 µM, 4 µM) for 24 h. Densitometric analysis are shown
below; (D,E) The plasmids of GFP-LC3B (green fluorescent protein-microtubule-associated protein 1 light chain 3B) and
mCherry-GFP-LC3B (mCherry fluorescent protein-green fluorescent protein-microtubule-associated protein 1 light chain
3B) was transferred into NIH-3T3 cells, and these cells subsequently were incubated with RG (2 µM, 4 µM) and/or TGF-β1
(5 ng/mL) for 12 h. DNA was counterstained with DAPI (blue). Scale bars: 50 µm; (F) Mlg cells were incubated with RG
(2 µM, 4 µM) and/or TGF-β1 (5 ng/mL) for 12 h, and the expression levels of mTOR (mechanistic target of rapamycin),
ULK-1 (protein kinase ULK1/autophagy-related protein 1), p70 S6K (p70 S6 kinase), and S6RP (S6 ribosomal protein), and
their phosphorylations were detected. Densitometric analysis are shown beside; (G) BLM-PPF cells were explored to RG
(2 µM, 4 µM) for 12 h, and Western Blot were used to detect the expression levels of mTOR, ULK-1, and S6RP, and their
phosphorylations. Densitometric analysis are shown beside. Data in (A–G) are means ± standard error of mean (SEM), and
GAPDH or β-tubulin were used as a loading control. # p < 0.05, ### p < 0.001, ** p < 0.01, *** p < 0.001(one-way ANOVA).
NS: not significant.")
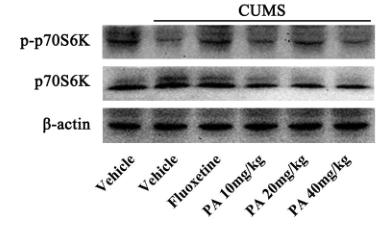
 Representative bands of mTOR, S6K, p‑mTOR and p‑S6K expression in the individual groups.")
. |Protein amounts of mTOR pathway efectors. (A) Representative immunoblot bands of various proteins.")
 (A), S6K1 protein phosphorylation (p-S6K1 Thr-389) (B), 4EBP1 protein phosphorylation (Thr-37/46) (C) in the gill of on-growing grass carp fed diets containing graded levels of Br-DMPT for 60 days, then infected with F. columnare for 3 days.Data represent means of six fish in each group, error bars indicate S.D. Values having different letters are significantly different (P < 0.05).")
 Representative images and quantification of autophagosomes and autolysosomes in Du145
and VCaP cells after Hispidulin treatment (10 and 50 μm) for 48 h (at 600× magnification and 800× magnification). Yellow puncta produced by merging GFP and RFP
puncta indicated autophagosomes; red puncta indicated autolysosomes. (b) MDC staining was conducted to detect autophagy in Du145 and VCaP cells after Hispidulin
treatment (10 and 50 μm) for 48 h. The relative protein levels of (C) LC3II/I, (d) p-mTOR, (E) p-S6K1 and (f) PPARγ in Du145 and VCaP cells after Hispidulin treatment (10
and 50 μm) for 48 h. (g) Electrophoretic mobility shift assay for PPARγ in Du145 and VCaP cells after Hispidulin treatment (10 and 50 μm) for 48 h. Data were represented
as mean ± SD at least 3 independent experiments and analyzed by one-way analysis of variance (ANOVA) followed by Tukey’s multiple comparison test. *
P < .05 vs
blank.")
, p-p70 S6K (A, C), p-AKT (A, D) and LC3 (A,
E) were detected by western blotting after FB1 exposure for 48 h. After pre-treatment of MHY1485 at 10 μM for 4 h, expression of p-mTOR (F, G), p-p70 S6K (F, H), pAKT (F, I) and LC3 (F, J) were measured. And indirect immunofluorescence of p-p70 S6K (K) was observed by laser scanning confocal microscope. The data were
presented as means ± SD, and were performed at least three times. Compared with control, * or #P < 0.05 was considered statistically significant, ** or ##P < 0.01
was considered strongly significant.")
. The phosphorylation levels of (B) p70S6K and 4E-BP1; (C) AMPK, ACC, and ULK1; (D) ERK1/2; (E) p38MAPK; and (F) eEF2 are shown. The phosphorylation is normalized to the total protein expression. The β-tubulin content in the lysate was measured as a loading control (G). The time course of these experiments is shown in the upper region. DM: differentiation medium, DMEM: Dulbecco’s modified Eagle’s medium, and w/o AA: without amino acids. Data are displayed as the means ± SD, and n = 4 for each group in all bar graphs. * p < 0.05 and ** p < 0.01 vs. the vehicle-treated group.")
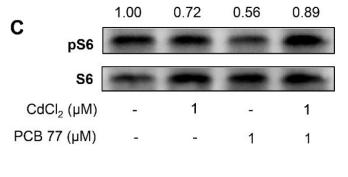
2D3 on altered mTOR activity induced by CoCl2 in placental trophoblasts. (A)Protein expression for p70S6K1 and P-p70S6K1 in HTR-8/SVneo trophoblast cells treated with CoCl2 in the presence or absence of 1,25(OH)2D3. p70S6K1 is one downstream indicator of mTOR signaling activity,1,25(OH)2D3 prevented CoCl2-induced decrease of P-p70S6K1 expression in trophoblasts. Te bar graphs show relative expression of p70S6K1 and P-p70S6K1 afer being normalized by β-actin in each sample from six independent experiments. **P<0.01, CoCl2 treated vs control; #P<0.05, 1,25(OH)2D3+ CoCl2 vs CoCl2 alone.")
 in CD4+ T cells were quantified by western blotting and showed as the relative expression values of β-actin, which was used as a loading control to normalize the protein levels. In order to highlight the activation level of p-mTOR and p-p70S6K in this signaling pathway, the ratio of p-mTOR to mTOR (p/t mTOR) and p-p70S6K to p70S6K (p/t p70S6K) were used for statistics. Data are shown as Mean ± SD (n = 6). Statistically significant differences were determined by two-tailed Student’s t-test. **P < 0.01, ***P < 0.001, ****P < 0.0001")
 patterns of mTOR pathway proteins, including mTOR, P-mTOR, downstream effectors p70s6k, p-p70s6k, 4EBP, and P-4EBP; (b) ERS-associated proteins, including GRP78 and CHOP; (c) apoptosis-associated proteins, including caspase-3, Bax, and Bcl-2. The protein expression was detected by immunoblotting. Data are mean ± SD. n = 4 biologically independent experiments (one-way ANOVA Tukey's post hoc test). ∗P < 0.05, ∗∗P < 0.01, and ∗∗∗P < 0.001.")
 Heat map visualization of DEG between TSPCs exposed to UA at the physiological level (0.2 mM) and the level corresponding to hyperuricemia (0.8 mM) for 48 h. (b) GO enrichment of gene sets from TSPCs impacted by hyperuricemia. (c) Cell lysates of TSPCs treated with PBS or various doses of UA for 48 h were tested for the AKT-mTOR pathway, the autophagy markers, and c-Jun activation by Western blot analysis. Results are representative of at least 3 independent experiments.")
 Notch1, (B) NICD1, (C) hairy and enhancer of split 1, (D) PTEN, (E-1) p-AKT (Thr308), (E-2) AKT, (E-3) p-AKT (Ser473), (F-1) p-mTOR (Ser2448), (F-2) mTORC1, (G) S6K1 (p70S6Kα), (H) S6K2 (p70S6Kβ) and (I) IL-17A in skin samples of experimental mice. *P")
 All mRNA expression levels in MC3T3-E1 cells were determined by using RT-PCR for p-PI3K, p-GSK-3β, p-AKT, and p-P70S6k. (b) Western blotting was used to analyze the expression of PI3K, AKT, GSK-3β, P70S6k, p-PI3K, p-AKT, p-GSK-3β, p-P70S6k, and β-actin proteins in MC3T3-E1 cells across treatment groups. MT stands for melatonin group; FAC+MT+LY294002 stands for the ferric ammonium citrate+melatonin+LY294002 group; PI3K stands for phosphatidylinositol kinase; p-PI3K stands for phosphorylated phosphatidylinositol kinase; AKT stands for protein kinase B; p-AKT stands for phosphorylated protein kinase B; p-GSK-3β stands for phosphorylated glycogen synthase kinase-3β; GSK-3β stands for glycogen synthase kinase-3β; P70S6 stands for ribosomal S6 protein kinase; p-P70S6k stands for phosphorylated ribosomal S6 protein kinase;")
 Western blotting results showed that RAPA inhibited the expression of p-mTOR and p-p70-S6k compared with in the control group. Statistical analysis of the (B) p-mTOR/mTOR ratio, (C) the p-p70-S6k/p70-S6k ratio and (D) the p-4E-BP1/4E-BP1 ratio at the protein level. Data are presented as the mean ± SD (n=3). *P")
 Protein synthesis related gene expression; (B) lipolysis-related gene expression; (C) Western blot analysis of p-AMPK, AMPK, PPARα, TOR, p70S6K, PI3K, and AKT protein expression; (D) relative quantification of p-AMPK, PPARα, TOR, p70S6K, PI3K, and AKT protein expression. The bars indicate the mean ± standard error (SE). Different superscripts denote significant differences (P < 0.05). CON = a control group (containing 4.95% crude fat); HFD = a high fat diet (containing 10.27% crude fat); HFDS = supplementing 1200 μg/kg sanguinarine to HFD.")
 Western blot analysis result of (a) TSPCs treated with different concentrations of leptin (0, 10, 50, 100 and 200 ng/mL) for 48 h; (b) a time course of LC3-I/II protein expression in TSPCs treated with 100 ng/mL leptin. Results were representatives of at least 3 biological replicates.")
 24 h after transfection, cells were cultured in basal medium without serum overnight; insulin (10 ng/μL) was added 2 h before harvest to activate phosphorylation of RPS6KB1. (A) FLAG-PPM1H was transfected into Hep-G2 cells with or without insulin treatment, and coIP was performed to examine the level of RPS6KB1 combined with PPM1H. (B) CoIP analysis of PPM1H and RPS6KB1 in FLAG-RPS6KB1-transfected Hep-G2 cells with or without insulin treatment. (C) Western blot analysis of the indicated protein levels in PPM1H-overexpressing Hep-G2 cells with or without insulin treatment. (D) In vitro phosphatase assay to determine the interaction between PPM1H and p-RPS6KB1. (E and F) Western blot analysis of the indicated protein levels in vector, ATF6, sh-NC, and sh-ATF6 transfected Hep-G2 cells (E) and in liver tissues of Atf6fl/fl or Atf6Δhep mice. (G) The RPS6KB1 inhibitor PF-4708671 was added to cells at a concentration of 10 μM, which effectively blocked phosphorylation of p-RPS6KB1. Transwell assays revealed that the migration and invasion of PF-4708671-treated Hep-G2 and Huh-7 cells showed little difference between vector and PPM1H. Magnification, ×100. (H) Quantification of (G). Data represent the mean ± SD of three independent experiments. ns, not significant.")
 The protein expression levels of p-mTORSer2448 and p-p70S6KThr389 in lung tissues of rats. (B)Effects of ECC-JHF II on proteins of the mTOR signaling pathway, such as Raptor, and p70S6K. Quantification analysis of relative band intensities by ImageJ (quantification results in all groups were divided by the result in the Control group). (C) Effect of the activated mTOR on ECC-JHF II regulating fibroblast phenotype conversion. After transfection with PolyJet™/DNA mixtures for 20 h, HFL cells were treated with 61.25 μg/ml ECC-JHF II and 5 ng/ml TGF-β1. Then, cells were collected to determine the expressions of α-SMA, FN, and mTOR signaling pathway-related proteins. pRK5: the vector backbone served as a negative control. All data are expressed as mean values ± SD, n = 3, *p < 0.05, ⁎⁎p < 0.01.")
 Western blotting assay underwent conduct after PC9, H1975, and A549 cell lines were transfected. (B) ImageJ software was used to quantify the protein expression. **p")
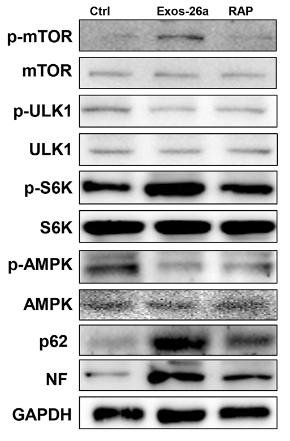
 and MLg (B) cells were exposed to oleuropein and/or TGF-β1 (5 ng/mL) for 12 h, after which samples were collected for Western blot analysis to assess the protein levels of mTOR, p-mTOR, ULK1, p-ULK1, p70 S6 kinase, p-p70 S6k, S6 ribosomal protein, and p-S6RP (original images can be found in Figure S1). The results are presented as Mean ± SD, n = 3, where # indicates differences between the control group and the TGF-β1 group, with # p < 0.05, ### p < 0.001, and #### p < 0.0001, and * indicates differences between the TGF-β1 group and the oleuropein treatment group")
, eukaryotic translation initiation factor 4E-binding protein 1 (4E-BP1) and 70 kDa ribosomal protein S6 kinase (p70S6k), phosphorylated (p)-mTOR, p-4E-BP1 and p-p70S6k and hypoxia-inducible facto-1α; C: Quantification of protein expression using ImageJ. Data are presented as the mean ± SD (n = 3). aP < 0.05. bP < 0.01. cP < 0.001. HIF-1α: Hypoxia-inducible factor-1α; ns: No significance; RAPA: Rapamycin; ATP: Adenosine triphosphate; mTOR: Mammalian target of rapamycin; p-mTOR: Phosphorylated-mammalian target of rapamycin; 4E-BP1: Eukaryotic translation initiation factor 4E-binding protein 1; p-4E-BP1: Phosphorylated-eukaryotic translation initiation factor 4E-binding protein 1; p70S6k: 70 kDa ribosomal protein S6 kinase; p-p70S6k: Phosphorylated-70 kDa ribosomal protein S6 kinase.")
| Product: | p70 S6 Kinase Antibody |
| Catalog: | AF6226 |
| Description: | Rabbit polyclonal antibody to p70 S6 Kinase |
| Application: | WB IHC IF/ICC |
| Cited expt.: | WB |
| Reactivity: | Human, Mouse, Rat |
| Prediction: | Bovine, Horse, Sheep, Rabbit, Dog, Chicken, Xenopus |
| Mol.Wt.: | 70kDa(Observed); 59kD(Calculated). |
| Uniprot: | P23443 |
| RRID: | AB_2835100 |
Control Products

Related Downloads
Protocols
Product Info
*The optimal dilutions should be determined by the end user. For optimal experimental results, antibody reuse is not recommended.
*Tips:
WB: For western blot detection of denatured protein samples. IHC: For immunohistochemical detection of paraffin sections (IHC-p) or frozen sections (IHC-f) of tissue samples. IF/ICC: For immunofluorescence detection of cell samples. ELISA(peptide): For ELISA detection of antigenic peptide.
Cite Format: Affinity Biosciences Cat# AF6226, RRID:AB_2835100.
Fold/Unfold
70 kDa ribosomal protein S6 kinase 1; KS6B1_HUMAN; p70 alpha; P70 beta 1; p70 ribosomal S6 kinase alpha; p70 ribosomal S6 kinase beta 1; p70 S6 kinase alpha; P70 S6 Kinase; p70 S6 kinase, alpha 1; p70 S6 kinase, alpha 2; p70 S6K; p70 S6K-alpha; p70 S6KA; p70(S6K) alpha; p70(S6K)-alpha; p70-alpha; p70-S6K 1; p70-S6K; P70S6K; P70S6K1; p70S6Kb; PS6K; Ribosomal protein S6 kinase 70kDa polypeptide 1; Ribosomal protein S6 kinase beta 1; Ribosomal protein S6 kinase beta-1; Ribosomal protein S6 kinase I; RPS6KB1; S6K; S6K-beta-1; S6K1; Serine/threonine kinase 14 alpha; Serine/threonine-protein kinase 14A; STK14A;
Immunogens
A synthesized peptide derived from human p70 S6 Kinase, corresponding to a region within the internal amino acids.
- P23443 KS6B1_HUMAN:
- Protein BLAST With
- NCBI/
- ExPASy/
- Uniprot
MRRRRRRDGFYPAPDFRDREAEDMAGVFDIDLDQPEDAGSEDELEEGGQLNESMDHGGVGPYELGMEHCEKFEISETSVNRGPEKIRPECFELLRVLGKGGYGKVFQVRKVTGANTGKIFAMKVLKKAMIVRNAKDTAHTKAERNILEEVKHPFIVDLIYAFQTGGKLYLILEYLSGGELFMQLEREGIFMEDTACFYLAEISMALGHLHQKGIIYRDLKPENIMLNHQGHVKLTDFGLCKESIHDGTVTHTFCGTIEYMAPEILMRSGHNRAVDWWSLGALMYDMLTGAPPFTGENRKKTIDKILKCKLNLPPYLTQEARDLLKKLLKRNAASRLGAGPGDAGEVQAHPFFRHINWEELLARKVEPPFKPLLQSEEDVSQFDSKFTRQTPVDSPDDSTLSESANQVFLGFTYVAPSVLESVKEKFSFEPKIRSPRRFIGSPRTPVSPVKFSPGDFWGRGASASTANPQTPVEYPMETSGIEQMDVTMSGEASAPLPIRQPNSGPYKKQAFPMISKRPEHLRMNL
Predictions
Score>80(red) has high confidence and is suggested to be used for WB detection. *The prediction model is mainly based on the alignment of immunogen sequences, the results are for reference only, not as the basis of quality assurance.
High(score>80) Medium(80>score>50) Low(score<50) No confidence
Research Backgrounds
Serine/threonine-protein kinase that acts downstream of mTOR signaling in response to growth factors and nutrients to promote cell proliferation, cell growth and cell cycle progression. Regulates protein synthesis through phosphorylation of EIF4B, RPS6 and EEF2K, and contributes to cell survival by repressing the pro-apoptotic function of BAD. Under conditions of nutrient depletion, the inactive form associates with the EIF3 translation initiation complex. Upon mitogenic stimulation, phosphorylation by the mammalian target of rapamycin complex 1 (mTORC1) leads to dissociation from the EIF3 complex and activation. The active form then phosphorylates and activates several substrates in the pre-initiation complex, including the EIF2B complex and the cap-binding complex component EIF4B. Also controls translation initiation by phosphorylating a negative regulator of EIF4A, PDCD4, targeting it for ubiquitination and subsequent proteolysis. Promotes initiation of the pioneer round of protein synthesis by phosphorylating POLDIP3/SKAR. In response to IGF1, activates translation elongation by phosphorylating EEF2 kinase (EEF2K), which leads to its inhibition and thus activation of EEF2. Also plays a role in feedback regulation of mTORC2 by mTORC1 by phosphorylating RICTOR, resulting in the inhibition of mTORC2 and AKT1 signaling. Mediates cell survival by phosphorylating the pro-apoptotic protein BAD and suppressing its pro-apoptotic function. Phosphorylates mitochondrial URI1 leading to dissociation of a URI1-PPP1CC complex. The free mitochondrial PPP1CC can then dephosphorylate RPS6KB1 at Thr-412, which is proposed to be a negative feedback mechanism for the RPS6KB1 anti-apoptotic function. Mediates TNF-alpha-induced insulin resistance by phosphorylating IRS1 at multiple serine residues, resulting in accelerated degradation of IRS1. In cells lacking functional TSC1-2 complex, constitutively phosphorylates and inhibits GSK3B. May be involved in cytoskeletal rearrangement through binding to neurabin. Phosphorylates and activates the pyrimidine biosynthesis enzyme CAD, downstream of MTOR. Following activation by mTORC1, phosphorylates EPRS and thereby plays a key role in fatty acid uptake by adipocytes and also most probably in interferon-gamma-induced translation inhibition.
Phosphorylation at Thr-412 is regulated by mTORC1. The phosphorylation at this site is maintained by an agonist-dependent autophosphorylation mechanism (By similarity). Activated by phosphorylation at Thr-252 by PDPK1. Dephosphorylation by PPP1CC at Thr-412 in mitochondrion.
Cell junction>Synapse>Synaptosome. Mitochondrion outer membrane. Mitochondrion.
Note: Colocalizes with URI1 at mitochondrion.
Nucleus. Cytoplasm.
Cytoplasm.
Widely expressed.
The autoinhibitory domain is believed to block phosphorylation within the AGC-kinase C-terminal domain and the activation loop.
The TOS (TOR signaling) motif is essential for activation by mTORC1.
Belongs to the protein kinase superfamily. AGC Ser/Thr protein kinase family. S6 kinase subfamily.
Research Fields
· Cellular Processes > Transport and catabolism > Autophagy - animal. (View pathway)
· Environmental Information Processing > Signal transduction > ErbB signaling pathway. (View pathway)
· Environmental Information Processing > Signal transduction > HIF-1 signaling pathway. (View pathway)
· Environmental Information Processing > Signal transduction > mTOR signaling pathway. (View pathway)
· Environmental Information Processing > Signal transduction > PI3K-Akt signaling pathway. (View pathway)
· Environmental Information Processing > Signal transduction > AMPK signaling pathway. (View pathway)
· Environmental Information Processing > Signal transduction > TGF-beta signaling pathway. (View pathway)
· Environmental Information Processing > Signal transduction > Apelin signaling pathway. (View pathway)
· Human Diseases > Drug resistance: Antineoplastic > EGFR tyrosine kinase inhibitor resistance.
· Human Diseases > Drug resistance: Antineoplastic > Endocrine resistance.
· Human Diseases > Endocrine and metabolic diseases > Insulin resistance.
· Human Diseases > Infectious diseases: Viral > Human papillomavirus infection.
· Human Diseases > Cancers: Overview > Pathways in cancer. (View pathway)
· Human Diseases > Cancers: Overview > Proteoglycans in cancer.
· Human Diseases > Cancers: Specific types > Colorectal cancer. (View pathway)
· Human Diseases > Cancers: Specific types > Pancreatic cancer. (View pathway)
· Human Diseases > Cancers: Specific types > Acute myeloid leukemia. (View pathway)
· Human Diseases > Cancers: Specific types > Breast cancer. (View pathway)
· Human Diseases > Cancers: Specific types > Hepatocellular carcinoma. (View pathway)
· Human Diseases > Cancers: Specific types > Gastric cancer. (View pathway)
· Human Diseases > Cancers: Overview > Choline metabolism in cancer. (View pathway)
· Organismal Systems > Aging > Longevity regulating pathway. (View pathway)
· Organismal Systems > Aging > Longevity regulating pathway - multiple species. (View pathway)
· Organismal Systems > Immune system > Fc gamma R-mediated phagocytosis. (View pathway)
· Organismal Systems > Endocrine system > Insulin signaling pathway. (View pathway)
References
Application: WB Species: Human Sample: HEL cells
Application: WB Species: Human Sample: CRC cells
Application: WB Species: Human Sample: pancreatic cancer tissue

Application: WB Species: Mouse Sample:
Application: WB Species: rat Sample: PC16 cells

Application: WB Species: Rat Sample: osteoblasts
Application: WB Species: rat Sample: hippocampus
Restrictive clause
Affinity Biosciences tests all products strictly. Citations are provided as a resource for additional applications that have not been validated by Affinity Biosciences. Please choose the appropriate format for each application and consult Materials and Methods sections for additional details about the use of any product in these publications.
For Research Use Only.
Not for use in diagnostic or therapeutic procedures. Not for resale. Not for distribution without written consent. Affinity Biosciences will not be held responsible for patent infringement or other violations that may occur with the use of our products. Affinity Biosciences, Affinity Biosciences Logo and all other trademarks are the property of Affinity Biosciences LTD.