Product: TNFSF15 Antibody
Catalog: DF3053
Description: Rabbit polyclonal antibody to TNFSF15
Application: WB IF/ICC
Reactivity: Human, Mouse
Prediction: Pig, Bovine, Horse, Sheep, Rabbit, Dog
Mol.Wt.: 20 KD; 28kD(Calculated).
Uniprot: O95150
RRID: AB_2835436

View similar products>>

   Size Price Inventory
 100ul $280 In stock
 200ul $350 In stock

Lead Time: Same day delivery

For pricing and ordering contact:
Local distributors

Product Info

Source:
Rabbit
Application:
WB 1:500-1:1000, IF/ICC 1:100-1:500
*The optimal dilutions should be determined by the end user.
*Tips:

WB: For western blot detection of denatured protein samples. IHC: For immunohistochemical detection of paraffin sections (IHC-p) or frozen sections (IHC-f) of tissue samples. IF/ICC: For immunofluorescence detection of cell samples. ELISA(peptide): For ELISA detection of antigenic peptide.

Reactivity:
Human,Mouse
Prediction:
Pig(89%), Bovine(89%), Horse(100%), Sheep(89%), Rabbit(89%), Dog(100%)
Clonality:
Polyclonal
Specificity:
TNFSF15 Antibody detects endogenous levels of total TNFSF15.
RRID:
AB_2835436
Cite Format: Affinity Biosciences Cat# DF3053, RRID:AB_2835436.
Conjugate:
Unconjugated.
Purification:
The antiserum was purified by peptide affinity chromatography using SulfoLink™ Coupling Resin (Thermo Fisher Scientific).
Storage:
Rabbit IgG in phosphate buffered saline , pH 7.4, 150mM NaCl, 0.02% sodium azide and 50% glycerol. Store at -20 °C. Stable for 12 months from date of receipt.
Alias:

Fold/Unfold

MGC129934; MGC129935; TL1 A; tl1; tl1a; tnf ligand related molecule 1; TNF ligand-related molecule 1; tnf superfamily ligand tl1a; TNF15_HUMAN; TNFSF15; Tumor necrosis factor (ligand) superfamily member 15; Tumor necrosis factor ligand superfamily member 15; Tumor necrosis factor ligand superfamily member 15, secreted form; Vascular endothelial cell growth inhibitor; Vascular endothelial growth inhibitor 192a; Vascular endothelial growth inhibitor; vegi; VEGI192A;

Immunogens

Immunogen:
Uniprot:
Gene(ID):
Expression:
O95150 TNF15_HUMAN:

Specifically expressed in endothelial cells. Detected in monocytes, placenta, lung, liver, kidney, skeletal muscle, pancreas, spleen, prostate, small intestine and colon.

Sequence:
MAEDLGLSFGETASVEMLPEHGSCRPKARSSSARWALTCCLVLLPFLAGLTTYLLVSQLRAQGEACVQFQALKGQEFAPSHQQVYAPLRADGDKPRAHLTVVRQTPTQHFKNQFPALHWEHELGLAFTKNRMNYTNKFLLIPESGDYFIYSQVTFRGMTSECSEIRQAGRPNKPDSITVVITKVTDSYPEPTQLLMGTKSVCEVGSNWFQPIYLGAMFSLQEGDKLMVNVSDISLVDYTKEDKTFFGAFLL

Predictions

Predictions:

Score>80(red) has high confidence and is suggested to be used for WB detection. *The prediction model is mainly based on the alignment of immunogen sequences, the results are for reference only, not as the basis of quality assurance.

Species
Results
Score
Horse
100
Dog
100
Pig
89
Bovine
89
Sheep
89
Rabbit
89
Xenopus
0
Zebrafish
0
Chicken
0
Model Confidence:
High(score>80) Medium(80>score>50) Low(score<50) No confidence

Research Backgrounds

Function:

Receptor for TNFRSF25 and TNFRSF6B. Mediates activation of NF-kappa-B. Inhibits vascular endothelial growth and angiogenesis (in vitro). Promotes activation of caspases and apoptosis.

Subcellular Location:

Membrane>Single-pass type II membrane protein.

Secreted.

Extracellular region or secreted Cytosol Plasma membrane Cytoskeleton Lysosome Endosome Peroxisome ER Golgi apparatus Nucleus Mitochondrion Manual annotation Automatic computational assertionSubcellular location
Tissue Specificity:

Specifically expressed in endothelial cells. Detected in monocytes, placenta, lung, liver, kidney, skeletal muscle, pancreas, spleen, prostate, small intestine and colon.

Subunit Structure:

Homotrimer.

Family&Domains:

Belongs to the tumor necrosis factor family.

Research Fields

· Environmental Information Processing > Signaling molecules and interaction > Cytokine-cytokine receptor interaction.   (View pathway)

References

1). TL1A/DR3 Axis, A Key Target of TNF-a, Augments the Epithelial–Mesenchymal Transformation of Epithelial Cells in OVA-Induced Asthma. Frontiers in Immunology (PubMed: 35359966) [IF=7.3]

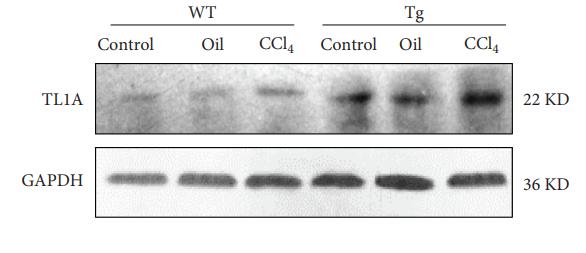
Application: WB    Species: Mouse    Sample: lung tissue

Figure 1 Animal experimental schedule is shown in (A) (n = 6 in each group). Analysis of differentially expressed proteins (DEPs) in OVA-induced asthma (M) compared with control (N). The boxplot shows the distribution of sample expression (B). The pie chart shows the number and proportion of DEPs between groups (C). The volcano plot exhibits the quantitative expression of DEPs between groups (D). The pie chart displays the subcellular localization of DEPs between groups (E). The chart shows the term of the top 20 significance of differential protein enrichment between groups (F). The chart illustrates the biological process, cellular component, and molecular function (G). Top 10 term of difference protein enrichment in the three branches (G). Finally, we combined the differential protein dataset to detect the changes of TNF-a (H) and TL1A/DR3 (I) in the mouse lungs via Western blotting analysis. (J) intensity analysis of (H). (K, L) intensity analysis of (I). Data are expressed as the means ± SD for three independent experiments. #p < 0.05 versus the control group.

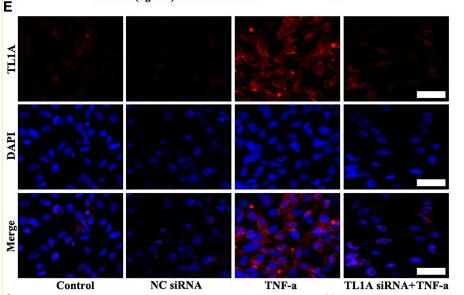
Application: IF/ICC    Species: Mouse    Sample: Beas-2B cells

Figure 8 Effects of the TL1A/DR3 axis on the EMT in Beas-2B cells were detected. TNF-a (50 ng/mL) stimulation for 48 h as the best cell model based on the above experimental results. The effect of sTL1A on EMT was detected by Western blotting (A, C). The effects of TL1A siRNA on TL1A induced by TNF-a were detected by immunofluorescence (E). Effects of TL1A siRNA on the EMT formation induced by TNF-a were measured by Western blotting analysis (G). (E): magnification 200 ×, scale bar 50 µm. (B, D, F, H) intensity analysis of (A, C, E, G), respectively. Data are expressed as the means ± SD for three independent experiments. #p < 0.05 versus the control group. #*p < 0.05 versus the TNF-a group.

2). The TL1A-DR3 Axis in Asthma: Membrane-Bound and Secreted TL1A Co-Determined the Development of Airway Remodeling. Allergy Asthma & Immunology Research (PubMed: 35255540) [IF=4.4]

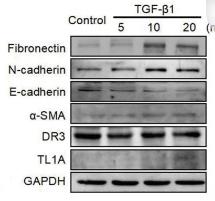
Application: WB    Species: Human    Sample: bronchial epithelial cells

Fig. 2 TL1A levels are increased after TGF-β1 treatment in bronchial epithelial cells. (A) Volcano plots were constructed using fold-change values and adjusted P. The red point in the plot represents overexpressed mRNAs and the blue point indicates down-regulated mRNAs with statistical significance. (B) The expression distribution of TNFSF15, where different colors represent different groups and the vertical axis represents the gene expression distribution. (C and D) Protein expression levels of E-cadherin, N-cadherin, fibronectin, DR3, TL1A, and α-SMA after treatment with different concentrations of TGF-β1 for 48 hours. (E) Immunofluorescence for collagen I, fibronectin, and TL1A after treatment with 20 ng/mL TGF-β1 for 48 hours. (F) The RNA levels of E-cadherin, collagen I, N-cadherin, fibronectin, DR3, TL1A, MMP-9. and α-SMA after treatment with different concentrations of TGF-β1 for 48 hours. (G-H) The levels of secreted TL1A remained unchanged in BEAS-2B cells treated with TGF-β1 at various concentrations and during various time courses. Data are expressed as means ± standard deviation. TGF, transforming growth factor; TL1A, tumor necrosis factor ligand-related molecule 1A; DR3, death receptor 3; MMP-9, matrix metallopeptidase 9; α-SMA, α-smooth muscle actin; GAPDH, glyceraldehyde 3-phosphate dehydrogenase. *P < 0.05, **P < 0.01 versus the control group.

3). Overexpression of Tumor Necrosis Factor-Like Ligand 1 A in Myeloid Cells Aggravates Liver Fibrosis in Mice. Journal of Immunology Research (PubMed: 30906791) [IF=4.1]

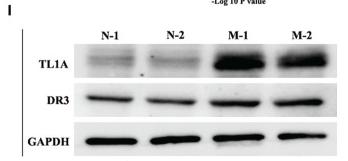
Application: WB    Species: mouse    Sample: liver tissues and macrophages

Figure 1 |: TL1A was upregulated in liver tissues and macrophages in mice with hepatic fibrosis. (a) The hepatic fibrosis model was established and verified by H&E and Sirius Red staining (200x). (b) The relative quantification of TL1A mRNA was measured by RT-PCR. (c, d) TL1A expression in the CCl4/WT group was significantly higher than those in the Control/WT and Oil/WT group, which was markedly higher in the CCl4/Tg group than that in the CCl4/WT group detected by Western blot.

Restrictive clause


Affinity Biosciences tests all products strictly. Citations are provided as a resource for additional applications that have not been validated by Affinity Biosciences. Please choose the appropriate format for each application and consult Materials and Methods sections for additional details about the use of any product in these publications.

For Research Use Only.
Not for use in diagnostic or therapeutic procedures. Not for resale. Not for distribution without written consent. Affinity Biosciences will not be held responsible for patent infringement or other violations that may occur with the use of our products. Affinity Biosciences, Affinity Biosciences Logo and all other trademarks are the property of Affinity Biosciences LTD.