CD133 Antibody - #AF5120

Related Downloads
Protocols
Product Info
*The optimal dilutions should be determined by the end user.
*Tips:
WB: For western blot detection of denatured protein samples. IHC: For immunohistochemical detection of paraffin sections (IHC-p) or frozen sections (IHC-f) of tissue samples. IF/ICC: For immunofluorescence detection of cell samples. ELISA(peptide): For ELISA detection of antigenic peptide.
Cite Format: Affinity Biosciences Cat# AF5120, RRID:AB_2837606.
Fold/Unfold
AC133; Antigen AC133; CD133; CORD12; Hematopoietic stem cell antigen; hProminin; MCDR2; MSTP061; OTTHUMP00000217744; OTTHUMP00000217745; OTTHUMP00000217746; PROM1; PROM1_HUMAN; Prominin I; Prominin like 1; Prominin like protein 1 precursor; Prominin mouse like 1; Prominin-1; Prominin-like protein 1; Prominin1; PROML1; RP41; STGD4;
Immunogens
Isoform 1 is selectively expressed on CD34 hematopoietic stem and progenitor cells in adult and fetal bone marrow, fetal liver, cord blood and adult peripheral blood. Isoform 1 is not detected on other blood cells. Isoform 1 is also expressed in a number of non-lymphoid tissues including retina, pancreas, placenta, kidney, liver, lung, brain and heart. Found in saliva within small membrane particles. Isoform 2 is predominantly expressed in fetal liver, skeletal muscle, kidney, and heart as well as adult pancreas, kidney, liver, lung, and placenta. Isoform 2 is highly expressed in fetal liver, low in bone marrow, and barely detectable in peripheral blood. Isoform 2 is expressed on hematopoietic stem cells and in epidermal basal cells (at protein level). Expressed in adult retina by rod and cone photoreceptor cells (at protein level).
- O43490 PROM1_HUMAN:
- Protein BLAST With
- NCBI/
- ExPASy/
- Uniprot
MALVLGSLLLLGLCGNSFSGGQPSSTDAPKAWNYELPATNYETQDSHKAGPIGILFELVHIFLYVVQPRDFPEDTLRKFLQKAYESKIDYDKPETVILGLKIVYYEAGIILCCVLGLLFIILMPLVGYFFCMCRCCNKCGGEMHQRQKENGPFLRKCFAISLLVICIIISIGIFYGFVANHQVRTRIKRSRKLADSNFKDLRTLLNETPEQIKYILAQYNTTKDKAFTDLNSINSVLGGGILDRLRPNIIPVLDEIKSMATAIKETKEALENMNSTLKSLHQQSTQLSSSLTSVKTSLRSSLNDPLCLVHPSSETCNSIRLSLSQLNSNPELRQLPPVDAELDNVNNVLRTDLDGLVQQGYQSLNDIPDRVQRQTTTVVAGIKRVLNSIGSDIDNVTQRLPIQDILSAFSVYVNNTESYIHRNLPTLEEYDSYWWLGGLVICSLLTLIVIFYYLGLLCGVCGYDRHATPTTRGCVSNTGGVFLMVGVGLSFLFCWILMIIVVLTFVFGANVEKLICEPYTSKELFRVLDTPYLLNEDWEYYLSGKLFNKSKMKLTFEQVYSDCKKNRGTYGTLHLQNSFNISEHLNINEHTGSISSELESLKVNLNIFLLGAAGRKNLQDFAACGIDRMNYDSYLAQTGKSPAGVNLLSFAYDLEAKANSLPPGNLRNSLKRDAQTIKTIHQQRVLPIEQSLSTLYQSVKILQRTGNGLLERVTRILASLDFAQNFITNNTSSVIIEETKKYGRTIIGYFEHYLQWIEFSISEKVASCKPVATALDTAVDVFLCSYIIDPLNLFWFGIGKATVFLLPALIFAVKLAKYYRRMDSEDVYDDVETIPMKNMENGNNGYHKDHVYGIHNPVMTSPSQH
PTMs - O43490 As Substrate
| Site | PTM Type | Enzyme | Source |
|---|---|---|---|
| Y34 | Phosphorylation | Uniprot | |
| K82 | Acetylation | Uniprot | |
| Y219 | Phosphorylation | Uniprot | |
| K225 | Acetylation | Uniprot | |
| K257 | Acetylation | Uniprot | |
| K264 | Acetylation | Uniprot | |
| T266 | Phosphorylation | Uniprot | |
| S275 | Phosphorylation | Uniprot | |
| T276 | Phosphorylation | Uniprot | |
| S719 | Phosphorylation | Uniprot | |
| S733 | Phosphorylation | Uniprot | |
| T739 | Phosphorylation | Uniprot | |
| S824 | Phosphorylation | Uniprot | |
| Y828 | Phosphorylation | P12931 (SRC) , P06241 (FYN) | Uniprot |
| T833 | Phosphorylation | Uniprot | |
| Y852 | Phosphorylation | P12931 (SRC) , P06241 (FYN) | Uniprot |
| S863 | Phosphorylation | Uniprot |
Research Backgrounds
May play a role in cell differentiation, proliferation and apoptosis. Binds cholesterol in cholesterol-containing plasma membrane microdomains and may play a role in the organization of the apical plasma membrane in epithelial cells. During early retinal development acts as a key regulator of disk morphogenesis. Involved in regulation of MAPK and Akt signaling pathways. In neuroblastoma cells suppresses cell differentiation such as neurite outgrowth in a RET-dependent manner.
Isoform 1 and isoform 2 are glycosylated.
Acetylation at Lys-225, Lys-257 and Lys-264 by NAT8 and NAT8B may control PROM1 protein expression and its function in cell apoptosis.
Apical cell membrane>Multi-pass membrane protein. Cell projection>Microvillus membrane>Multi-pass membrane protein. Cell projection>Cilium>Photoreceptor outer segment. Endoplasmic reticulum. Endoplasmic reticulum-Golgi intermediate compartment.
Note: Found in extracellular membrane particles in various body fluids such as cerebrospinal fluid, saliva, seminal fluid and urine.
Isoform 1 is selectively expressed on CD34 hematopoietic stem and progenitor cells in adult and fetal bone marrow, fetal liver, cord blood and adult peripheral blood. Isoform 1 is not detected on other blood cells. Isoform 1 is also expressed in a number of non-lymphoid tissues including retina, pancreas, placenta, kidney, liver, lung, brain and heart. Found in saliva within small membrane particles. Isoform 2 is predominantly expressed in fetal liver, skeletal muscle, kidney, and heart as well as adult pancreas, kidney, liver, lung, and placenta. Isoform 2 is highly expressed in fetal liver, low in bone marrow, and barely detectable in peripheral blood. Isoform 2 is expressed on hematopoietic stem cells and in epidermal basal cells (at protein level). Expressed in adult retina by rod and cone photoreceptor cells (at protein level).
Interacts with CDHR1 and with actin filaments. Interacts with NAT8 and NAT8B.
Belongs to the prominin family.
Research Fields
· Human Diseases > Cancers: Overview > Transcriptional misregulation in cancer.
References
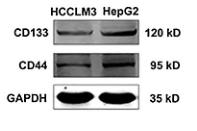
Application: WB Species: Human Sample: HepG2 cells
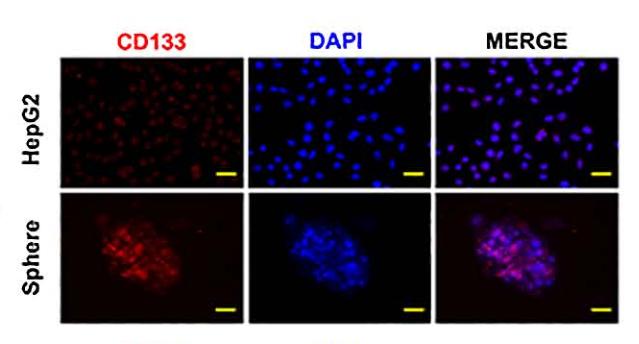
Application: IF/ICC Species: Human Sample: HepG2 cells
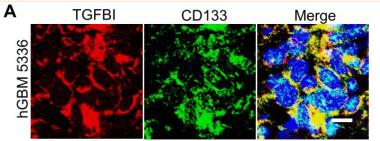
Application: IF/ICC Species: Human Sample:
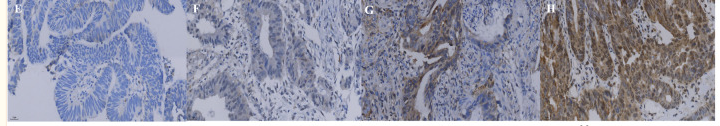
Application: IHC Species: Human Sample:
Restrictive clause
Affinity Biosciences tests all products strictly. Citations are provided as a resource for additional applications that have not been validated by Affinity Biosciences. Please choose the appropriate format for each application and consult Materials and Methods sections for additional details about the use of any product in these publications.
For Research Use Only.
Not for use in diagnostic or therapeutic procedures. Not for resale. Not for distribution without written consent. Affinity Biosciences will not be held responsible for patent infringement or other violations that may occur with the use of our products. Affinity Biosciences, Affinity Biosciences Logo and all other trademarks are the property of Affinity Biosciences LTD.