Product: CTLA4 Antibody
Catalog: DF6793
Description: Rabbit polyclonal antibody to CTLA4
Application: WB IHC
Reactivity: Human, Mouse
Prediction: Pig, Horse, Rabbit, Dog, Chicken
Mol.Wt.: 25kDa; 25kD(Calculated).
Uniprot: P16410
RRID: AB_2838755

View similar products>>

   Size Price Inventory
 100ul $280 In stock
 200ul $350 In stock

Lead Time: Same day delivery

For pricing and ordering contact:
Local distributors

Product Info

Source:
Rabbit
Application:
WB 1:500-1:2000, IHC 1:50-1:200
*The optimal dilutions should be determined by the end user.
*Tips:

WB: For western blot detection of denatured protein samples. IHC: For immunohistochemical detection of paraffin sections (IHC-p) or frozen sections (IHC-f) of tissue samples. IF/ICC: For immunofluorescence detection of cell samples. ELISA(peptide): For ELISA detection of antigenic peptide.

Reactivity:
Human,Mouse
Prediction:
Pig(100%), Horse(91%), Rabbit(91%), Dog(100%), Chicken(90%)
Clonality:
Polyclonal
Specificity:
CTLA4 Antibody detects endogenous levels of total CTLA4.
RRID:
AB_2838755
Cite Format: Affinity Biosciences Cat# DF6793, RRID:AB_2838755.
Conjugate:
Unconjugated.
Purification:
The antiserum was purified by peptide affinity chromatography using SulfoLink™ Coupling Resin (Thermo Fisher Scientific).
Storage:
Rabbit IgG in phosphate buffered saline , pH 7.4, 150mM NaCl, 0.02% sodium azide and 50% glycerol. Store at -20 °C. Stable for 12 months from date of receipt.
Alias:

Fold/Unfold

ALPS5; CD 152; CD; CD152; CD152 antigen; CD152 isoform; Celiac disease 3; CELIAC3; CTLA 4; CTLA-4; CTLA4; CTLA4_HUMAN; Cytotoxic T cell associated 4; Cytotoxic T lymphocyte antigen 4; Cytotoxic T lymphocyte associated 4; Cytotoxic T lymphocyte associated 4, soluble isoform, included; Cytotoxic T lymphocyte associated antigen 4; Cytotoxic T lymphocyte associated antigen 4 short spliced form; Cytotoxic T lymphocyte associated protein 4; Cytotoxic T lymphocyte associated serine esterase 4; Cytotoxic T lymphocyte protein 4; Cytotoxic T-lymphocyte protein 4; Cytotoxic T-lymphocyte-associated antigen 4; GRD4; GSE; ICOS; IDDM12; insulin-dependent diabetes mellitus 12; Ligand and transmembrane spliced cytotoxic T lymphocyte associated antigen 4; OTTHUMP00000216623;

Immunogens

Immunogen:
Uniprot:
Gene(ID):
Expression:
P16410 CTLA4_HUMAN:

Widely expressed with highest levels in lymphoid tissues. Detected in activated T-cells where expression levels are 30- to 50-fold less than CD28, the stimulatory coreceptor, on the cell surface following activation.

Description:
This gene is a member of the immunoglobulin superfamily and encodes a protein which transmits an inhibitory signal to T cells. The protein contains a V domain, a transmembrane domain, and a cytoplasmic tail. Alternate transcriptional splice variants, encoding different isoforms, have been characterized. The membrane-bound isoform functions as a homodimer interconnected by a disulfide bond, while the soluble isoform functions as a monomer. Mutations in this gene have been associated with insulin-dependent diabetes mellitus, Graves disease, Hashimoto thyroiditis, celiac disease, systemic lupus erythematosus, thyroid-associated orbitopathy, and other autoimmune diseases. [provided by RefSeq, Jul 2008]
Sequence:
MACLGFQRHKAQLNLATRTWPCTLLFFLLFIPVFCKAMHVAQPAVVLASSRGIASFVCEYASPGKATEVRVTVLRQADSQVTEVCAATYMMGNELTFLDDSICTGTSSGNQVNLTIQGLRAMDTGLYICKVELMYPPPYYLGIGNGTQIYVIDPEPCPDSDFLLWILAAVSSGLFFYSFLLTAVSLSKMLKKRSPLTTGVYVKMPPTEPECEKQFQPYFIPIN

Predictions

Predictions:

Score>80(red) has high confidence and is suggested to be used for WB detection. *The prediction model is mainly based on the alignment of immunogen sequences, the results are for reference only, not as the basis of quality assurance.

Species
Results
Score
Pig
100
Dog
100
Horse
91
Rabbit
91
Chicken
90
Bovine
0
Sheep
0
Xenopus
0
Zebrafish
0
Model Confidence:
High(score>80) Medium(80>score>50) Low(score<50) No confidence

PTMs - P16410 As Substrate

Site PTM Type Enzyme
S55 Phosphorylation
Y60 Phosphorylation
N113 N-Glycosylation
N145 N-Glycosylation
Y165 Phosphorylation
Y182 Phosphorylation
Y201 Phosphorylation P06239 (LCK) , P42681 (TXK) , O60674 (JAK2) , P06241 (FYN)
Y218 Phosphorylation P06239 (LCK) , P06241 (FYN)

Research Backgrounds

Function:

Inhibitory receptor acting as a major negative regulator of T-cell responses. The affinity of CTLA4 for its natural B7 family ligands, CD80 and CD86, is considerably stronger than the affinity of their cognate stimulatory coreceptor CD28.

PTMs:

N-glycosylation is important for dimerization.

Phosphorylation at Tyr-201 prevents binding to the AP-2 adapter complex, blocks endocytosis, and leads to retention of CTLA4 on the cell surface.

Subcellular Location:

Cell membrane>Single-pass type I membrane protein.
Note: Exists primarily an intracellular antigen whose surface expression is tightly regulated by restricted trafficking to the cell surface and rapid internalisation;.

Extracellular region or secreted Cytosol Plasma membrane Cytoskeleton Lysosome Endosome Peroxisome ER Golgi apparatus Nucleus Mitochondrion Manual annotation Automatic computational assertionSubcellular location
Tissue Specificity:

Widely expressed with highest levels in lymphoid tissues. Detected in activated T-cells where expression levels are 30- to 50-fold less than CD28, the stimulatory coreceptor, on the cell surface following activation.

Subunit Structure:

Homodimer; disulfide-linked Ref.23,. Binds to CD80/B7-1 and CD86/B7.2. Interacts with ICOSLG.

Research Fields

· Environmental Information Processing > Signaling molecules and interaction > Cell adhesion molecules (CAMs).   (View pathway)

· Human Diseases > Immune diseases > Autoimmune thyroid disease.

· Human Diseases > Immune diseases > Rheumatoid arthritis.

· Organismal Systems > Immune system > T cell receptor signaling pathway.   (View pathway)

References

1). Vascular endothelial growth factor A is a potential prognostic biomarker and correlates with immune cell infiltration in hepatocellular carcinoma. Journal of Cellular and Molecular Medicine (PubMed: 36729917) [IF=5.3]

2). GOLM1 is related to the inflammatory/immune nature of uveal melanoma and acts as a promising indicator for prognosis and immunotherapy response. Frontiers in Genetics (PubMed: 36468024) [IF=3.7]

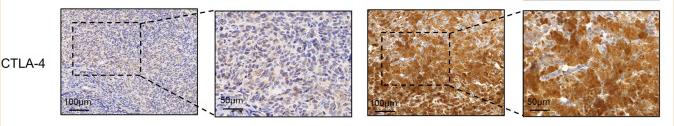
Application: IHC    Species: Human    Sample: tumor tissues

FIGURE 7 Correlation between GOLM1 expression and PD-1, PD-L1, CTLA4, and IFN-γ. (A) Immunohistochemistry assay revealed the protein expression of GOLM1, PD-1, PD-L1, CTLA4, and IFN-γ. (B,C) The expression difference of PD-1 among GOLM1-low (LEXP) and GOLM1-high (HEXP) subgroups (B) and the correlation between PD-1 and GOLM1 expression (C). (D,E) The expression difference of PD-L1 among the LEXP and HEXP groups (D) and the correlation between PD-L1 and GOLM1 expression (E). (F,G) The expression difference of CTLA4 among the LEXP and HEXP groups (F) and the correlation between CTLA4 and GOLM1 expression (G). (H,I) The expression difference of IFN-γ among the LEXP and HEXP groups (H) and the correlation between IFN-γ and GOLM1 expression (I).

3). High Expression of Ferritinophagy-Related RRM2 Gene in Relation to Unfavorable Outcome and Immune Cells Infiltration in Hepatocellular Carcinoma.

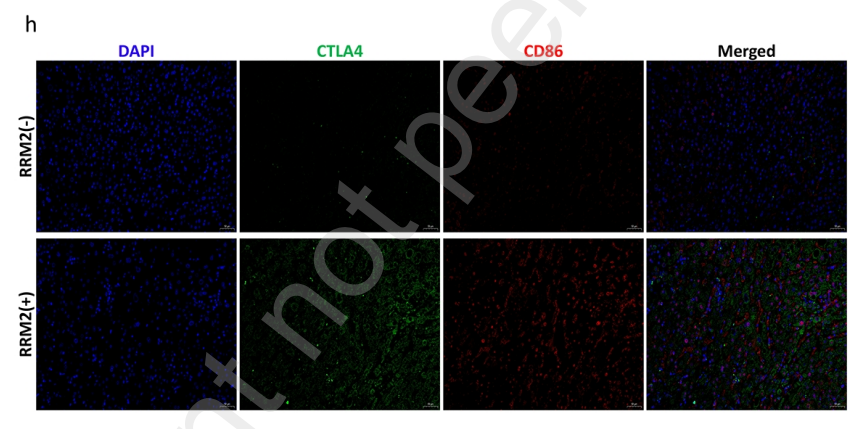
Application: IF/ICC    Species: Human    Sample: HCC tissues

Figure 7. Correlation analysis of RRM2 expression and immunotherapy markers in HCC. (a-d) Correlation between RRM2 expression level and PDCD1, CD274, CTLA4 and CD86 expression levels in HCC tissues based on TCGA database. (e) RRM2 mRNA expression in paracancerous and hepatocellular carcinoma tissues by PCR. (f) PD-L1 mRNA expression in paracancerous and hepatocellular carcinoma tissues by PCR. (g) Correlation between expression of RRM2 and PL This preprint research paper has not been peer reviewed. Electronic copy available at: https://ssrn.com/abstract=4072482 Correlations between overall survival and mRNA expression of RRM2 analyzed by and univariate Cox regression. (b) Correlations between overall survival and mRNA expression of RRM2 analyzed by multivariate Cox regression. (c-e) The expression level of RRM2 was negatively correlated with OS, DSS and PFI of HCC by TCGA database. (f-h) Kaplan-meier Plotter was used to analyze the expression levels of RRM2 in GEO, EGA and TCGA databases and there was a negative correlation with OS, DSS and PFI of HCC Figure 5. Enrichment analysis of RRM2 functional networks. (a-b) Enrichment plots by GSEA. (c-d) Enrichment of gene ontology (GO) terms and Kyoto Encyclopedia of Genes and Genomes (KEGG) for genes related to RRM2. (e) Protein–protein interaction network of RRM2. (f-i) Correlation between RRM2 expression levels and Top2A, BUB1B, KIF11 and CDC20 expression levels. (j) The heat map shows the top 50 genes positively related to RRM2 in the HCC cohort. (k) The heat map shows the top 50 genes negatively related to RRM2 in the HCC cohort. Figure 6. Correlation analysis of RRM2 expression and infiltration levels of immune cells in tumor tissues. (a) The relationship between RRM2 mRNA expression and CD8+ T cell and Regulatory T Cell in various tumors was evaluated using a variety of algorithms based on the TIMER database. (b) RRM2 expression was positively correlated with tumor purity and infiltration levels of B cells, CD8+ T cells, CD4+ T cells, macrophages, and DCs in HCC tissues based on the TIMER database. (c) Correlation between RRM2 expression level and infiltration of various immune cells (Th2 Cell、 T helper Cell、TFH、aDC、NK CD56bright Cell、Macrophages、Th1 cell、T cell、B cell、 Tcm、Treg、iDC、NK CD58dim Cell、Tem、Eosinophils、Tgd、Mast cell、Th17 Cell、 NK Cell、pDC、Cytotoxic Cell、CD8+ T cell、DC、Neutrophils) in HCC tissues. Figure 7. Correlation analysis of RRM2 expression and immunotherapy markers in HCC. (a-d) Correlation between RRM2 expression level and PDCD1, CD274, CTLA4 and CD86 expression levels in HCC tissues based on TCGA database. (e) RRM2 mRNA expression in paracancerous and hepatocellular carcinoma tissues by PCR. (f) PD-L1 mRNA expression in paracancerous and eprint not peer reviewe

Restrictive clause


Affinity Biosciences tests all products strictly. Citations are provided as a resource for additional applications that have not been validated by Affinity Biosciences. Please choose the appropriate format for each application and consult Materials and Methods sections for additional details about the use of any product in these publications.

For Research Use Only.
Not for use in diagnostic or therapeutic procedures. Not for resale. Not for distribution without written consent. Affinity Biosciences will not be held responsible for patent infringement or other violations that may occur with the use of our products. Affinity Biosciences, Affinity Biosciences Logo and all other trademarks are the property of Affinity Biosciences LTD.