alpha SMA Antibody - #BF9212

Product Info
*The optimal dilutions should be determined by the end user.
*Tips:
WB: For western blot detection of denatured protein samples. IHC: For immunohistochemical detection of paraffin sections (IHC-p) or frozen sections (IHC-f) of tissue samples. IF/ICC: For immunofluorescence detection of cell samples. ELISA(peptide): For ELISA detection of antigenic peptide.
Cite Format: Affinity Biosciences Cat# BF9212, RRID:AB_2839428.
Fold/Unfold
a actin; AAT6; ACTA_HUMAN; ACTA2; Actin alpha 2 smooth muscle aorta; Actin aortic smooth muscle; Actin; aortic smooth muscle; ACTSA; ACTVS; Alpha 2 actin; Alpha actin 2; Alpha cardiac actin; Alpha-actin-2; Cell growth inhibiting gene 46 protein; Cell growth-inhibiting gene 46 protein; GIG46; Growth inhibiting gene 46; MYMY5; Sarcomeric Actin;
Immunogens
A Mouse monoclonal antibody is prepared by immunizing recombinant protein.
- P62736 ACTA_HUMAN:
- Protein BLAST With
- NCBI/
- ExPASy/
- Uniprot
MCEEEDSTALVCDNGSGLCKAGFAGDDAPRAVFPSIVGRPRHQGVMVGMGQKDSYVGDEAQSKRGILTLKYPIEHGIITNWDDMEKIWHHSFYNELRVAPEEHPTLLTEAPLNPKANREKMTQIMFETFNVPAMYVAIQAVLSLYASGRTTGIVLDSGDGVTHNVPIYEGYALPHAIMRLDLAGRDLTDYLMKILTERGYSFVTTAEREIVRDIKEKLCYVALDFENEMATAASSSSLEKSYELPDGQVITIGNERFRCPETLFQPSFIGMESAGIHETTYNSIMKCDIDIRKDLYANNVLSGGTTMYPGIADRMQKEITALAPSTMKIKIIAPPERKYSVWIGGSILASLSTFQQMWISKQEYDEAGPSIVHRKCF
PTMs - P62736 As Substrate
| Site | PTM Type | Enzyme | Source |
|---|---|---|---|
| E3 | Acetylation | Uniprot | |
| S35 | Phosphorylation | Uniprot | |
| K52 | Acetylation | Uniprot | |
| K52 | Methylation | Uniprot | |
| K52 | Ubiquitination | Uniprot | |
| S54 | Phosphorylation | Uniprot | |
| Y55 | Phosphorylation | Uniprot | |
| S62 | Phosphorylation | Uniprot | |
| K63 | Acetylation | Uniprot | |
| K63 | Sumoylation | Uniprot | |
| K63 | Ubiquitination | Uniprot | |
| T68 | Phosphorylation | Uniprot | |
| K70 | Acetylation | Uniprot | |
| K70 | Methylation | Uniprot | |
| K70 | Ubiquitination | Uniprot | |
| Y71 | Phosphorylation | Uniprot | |
| T79 | Phosphorylation | Uniprot | |
| K86 | Acetylation | Uniprot | |
| K86 | Methylation | Uniprot | |
| S91 | Phosphorylation | Uniprot | |
| Y93 | Phosphorylation | Uniprot | |
| R97 | Methylation | Uniprot | |
| K115 | Acetylation | Uniprot | |
| K115 | Ubiquitination | Uniprot | |
| T128 | Phosphorylation | Uniprot | |
| Y145 | Phosphorylation | Uniprot | |
| T151 | Phosphorylation | Uniprot | |
| S157 | Phosphorylation | Uniprot | |
| Y168 | Phosphorylation | Uniprot | |
| Y171 | Phosphorylation | Uniprot | |
| T188 | Phosphorylation | Uniprot | |
| Y190 | Phosphorylation | Uniprot | |
| K193 | Acetylation | Uniprot | |
| K193 | Methylation | Uniprot | |
| K193 | Ubiquitination | Uniprot | |
| T196 | Phosphorylation | Uniprot | |
| R198 | Methylation | Uniprot | |
| Y200 | Phosphorylation | Uniprot | |
| S201 | Phosphorylation | Uniprot | |
| T204 | Phosphorylation | Uniprot | |
| K215 | Acetylation | Uniprot | |
| K215 | Ubiquitination | Uniprot | |
| K217 | Acetylation | Uniprot | |
| K217 | Methylation | Uniprot | |
| C219 | S-Nitrosylation | Uniprot | |
| Y220 | Phosphorylation | Uniprot | |
| S235 | Phosphorylation | Uniprot | |
| S236 | Phosphorylation | Uniprot | |
| S237 | Phosphorylation | Uniprot | |
| K240 | Ubiquitination | Uniprot | |
| S241 | Phosphorylation | Uniprot | |
| Y242 | Phosphorylation | Uniprot | |
| T251 | Phosphorylation | Uniprot | |
| C259 | S-Nitrosylation | Uniprot | |
| T262 | Phosphorylation | Uniprot | |
| S267 | Phosphorylation | Uniprot | |
| T280 | Phosphorylation | Uniprot | |
| Y281 | Phosphorylation | Uniprot | |
| S283 | Phosphorylation | Uniprot | |
| C287 | S-Nitrosylation | Uniprot | |
| K293 | Ubiquitination | Uniprot | |
| Y296 | Phosphorylation | Uniprot | |
| T305 | Phosphorylation | Uniprot | |
| T306 | Phosphorylation | Uniprot | |
| Y308 | Phosphorylation | Uniprot | |
| K317 | Acetylation | Uniprot | |
| K317 | Sumoylation | Uniprot | |
| K317 | Ubiquitination | Uniprot | |
| T320 | Phosphorylation | Uniprot | |
| S325 | Phosphorylation | Uniprot | |
| T326 | Phosphorylation | Uniprot | |
| K328 | Acetylation | Uniprot | |
| K328 | Methylation | Uniprot | |
| K328 | Sumoylation | Uniprot | |
| K328 | Ubiquitination | Uniprot | |
| K330 | Acetylation | Uniprot | |
| K330 | Sumoylation | Uniprot | |
| K330 | Ubiquitination | Uniprot | |
| K338 | Sumoylation | Uniprot | |
| S350 | Phosphorylation | Uniprot | |
| Y364 | Phosphorylation | Uniprot | |
| S370 | Phosphorylation | Uniprot | |
| K375 | Ubiquitination | Uniprot | |
| C376 | S-Nitrosylation | Uniprot |
Research Backgrounds
Actins are highly conserved proteins that are involved in various types of cell motility and are ubiquitously expressed in all eukaryotic cells.
Oxidation of Met-46 and Met-49 by MICALs (MICAL1, MICAL2 or MICAL3) to form methionine sulfoxide promotes actin filament depolymerization. MICAL1 and MICAL2 produce the (R)-S-oxide form. The (R)-S-oxide form is reverted by MSRB1 and MSRB2, which promotes actin repolymerization.
Monomethylation at Lys-86 (K84me1) regulates actin-myosin interaction and actomyosin-dependent processes. Demethylation by ALKBH4 is required for maintaining actomyosin dynamics supporting normal cleavage furrow ingression during cytokinesis and cell migration.
Methylated at His-75 by SETD3.
(Microbial infection) Monomeric actin is cross-linked by V.cholerae toxins RtxA and VgrG1 in case of infection: bacterial toxins mediate the cross-link between Lys-52 of one monomer and Glu-272 of another actin monomer, resulting in formation of highly toxic actin oligomers that cause cell rounding. The toxin can be highly efficient at very low concentrations by acting on formin homology family proteins: toxic actin oligomers bind with high affinity to formins and adversely affect both nucleation and elongation abilities of formins, causing their potent inhibition in both profilin-dependent and independent manners.
Cytoplasm>Cytoskeleton.
Polymerization of globular actin (G-actin) leads to a structural filament (F-actin) in the form of a two-stranded helix. Each actin can bind to 4 others.
Belongs to the actin family.
Research Fields
· Environmental Information Processing > Signal transduction > Apelin signaling pathway. (View pathway)
· Organismal Systems > Circulatory system > Vascular smooth muscle contraction. (View pathway)
· Organismal Systems > Endocrine system > Relaxin signaling pathway.
References
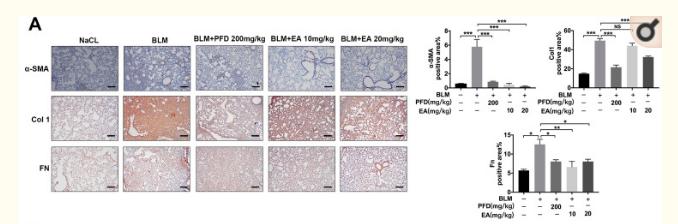
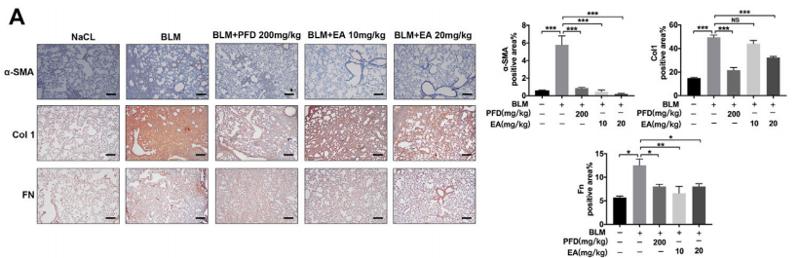
Application: IHC Species: mice Sample: lung tissue

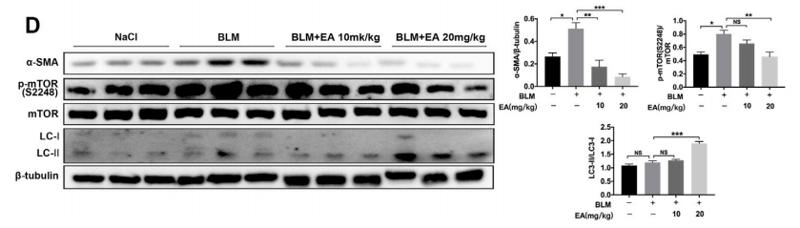
Application: WB Species: mice Sample: lung tissue
Application: IHC Species: mouse Sample: Lung
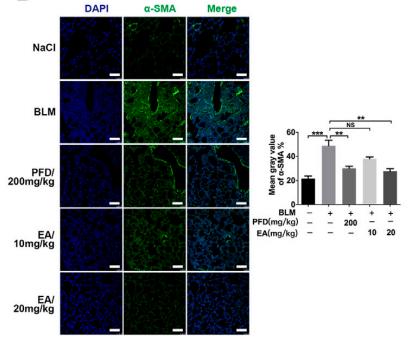
Application: IF/ICC Species: mouse Sample: Lung
Application: WB Species: mouse Sample: Lung
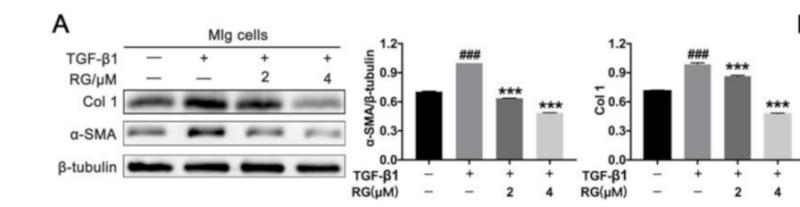
Application: WB Species: Mouse Sample: Mouse lung fibroblast (Mlg) or NaCl-primary pulmonary fibroblast (PPF) cells
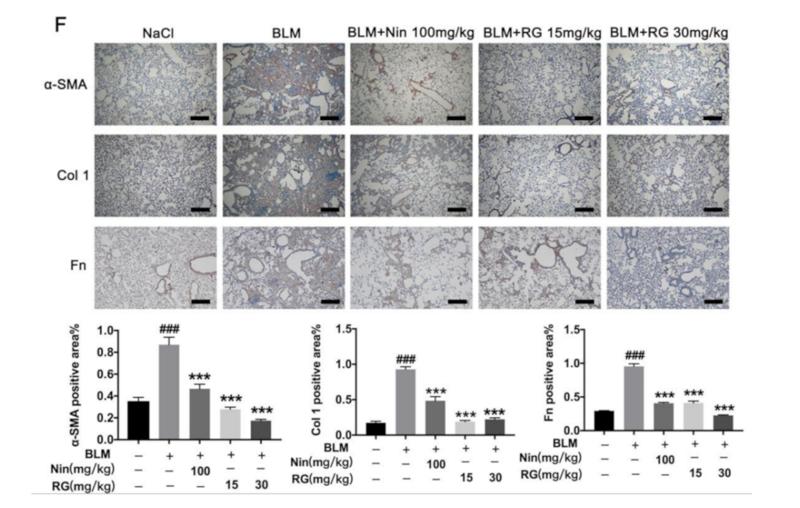
Application: IHC Species: mice Sample: lung tissue
Application: WB Species: Mice Sample: lung tissues

Application: WB Species: Mouse Sample: MLE-12 cells

Application: WB Species: Mice Sample: kidneys
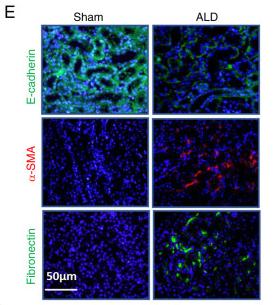
Application: IF/ICC Species: Mice Sample: kidneys
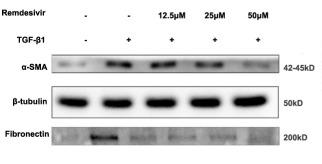
Application: WB Species: Human Sample: MRC-5 cells

Application: IF/ICC Species: Human Sample: MRC-5 cells
Restrictive clause
Affinity Biosciences tests all products strictly. Citations are provided as a resource for additional applications that have not been validated by Affinity Biosciences. Please choose the appropriate format for each application and consult Materials and Methods sections for additional details about the use of any product in these publications.
For Research Use Only.
Not for use in diagnostic or therapeutic procedures. Not for resale. Not for distribution without written consent. Affinity Biosciences will not be held responsible for patent infringement or other violations that may occur with the use of our products. Affinity Biosciences, Affinity Biosciences Logo and all other trademarks are the property of Affinity Biosciences LTD.