Product: Gli1 Antibody
Catalog: DF7523
Description: Rabbit polyclonal antibody to Gli1
Application: WB IHC IF/ICC
Cited expt.: WB, IHC, IF/ICC
Reactivity: Human, Mouse, Rat
Mol.Wt.: 118 kDa; 118kD(Calculated).
Uniprot: P08151
RRID: AB_2841022

View similar products>>

   Size Price Inventory
 100ul $280 In stock
 200ul $350 In stock

Lead Time: Same day delivery

For pricing and ordering contact:
Local distributors

Product Info

Source:
Rabbit
Application:
WB 1:1000-3000, IHC 1:50-1:200, IF/ICC 1:100-1:500
*The optimal dilutions should be determined by the end user. For optimal experimental results, antibody reuse is not recommended.
*Tips:

WB: For western blot detection of denatured protein samples. IHC: For immunohistochemical detection of paraffin sections (IHC-p) or frozen sections (IHC-f) of tissue samples. IF/ICC: For immunofluorescence detection of cell samples. ELISA(peptide): For ELISA detection of antigenic peptide.

Reactivity:
Human,Mouse,Rat
Clonality:
Polyclonal
Specificity:
Gli1 Antibody detects endogenous levels of total Gli1.
RRID:
AB_2841022
Cite Format: Affinity Biosciences Cat# DF7523, RRID:AB_2841022.
Conjugate:
Unconjugated.
Purification:
The antiserum was purified by peptide affinity chromatography using SulfoLink™ Coupling Resin (Thermo Fisher Scientific).
Storage:
Rabbit IgG in phosphate buffered saline , pH 7.4, 150mM NaCl, 0.02% sodium azide and 50% glycerol. Store at -20 °C. Stable for 12 months from date of receipt.
Alias:

Fold/Unfold

Gli 1; GLI; GLI family zinc finger 1; GLI Kruppel family member 1; gli1; GLI1_HUMAN; Glioma associated oncogene 1; Glioma associated oncogene homolog 1 (zinc finger protein); Glioma associated oncogene homolog; Glioma-associated oncogene; Oncogene GLI; Zfp 5; Zfp5; Zinc finger protein GLI 1; Zinc finger protein GLI1;

Immunogens

Immunogen:

A synthesized peptide derived from human Gli1, corresponding to a region within C-terminal amino acids.

Uniprot:
Gene(ID):
Expression:
P08151 GLI1_HUMAN:

Detected in testis (at protein level) (PubMed:2105456). Testis, myometrium and fallopian tube. Also expressed in the brain with highest expression in the cerebellum, optic nerve and olfactory tract (PubMed:19878745). Isoform 1 is detected in brain, spleen, pancreas, liver, kidney and placenta; isoform 2 is not detectable in these tissues (PubMed:19706761).

Sequence:
MFNSMTPPPISSYGEPCCLRPLPSQGAPSVGTEGLSGPPFCHQANLMSGPHSYGPARETNSCTEGPLFSSPRSAVKLTKKRALSISPLSDASLDLQTVIRTSPSSLVAFINSRCTSPGGSYGHLSIGTMSPSLGFPAQMNHQKGPSPSFGVQPCGPHDSARGGMIPHPQSRGPFPTCQLKSELDMLVGKCREEPLEGDMSSPNSTGIQDPLLGMLDGREDLEREEKREPESVYETDCRWDGCSQEFDSQEQLVHHINSEHIHGERKEFVCHWGGCSRELRPFKAQYMLVVHMRRHTGEKPHKCTFEGCRKSYSRLENLKTHLRSHTGEKPYMCEHEGCSKAFSNASDRAKHQNRTHSNEKPYVCKLPGCTKRYTDPSSLRKHVKTVHGPDAHVTKRHRGDGPLPRAPSISTVEPKREREGGPIREESRLTVPEGAMKPQPSPGAQSSCSSDHSPAGSAANTDSGVEMTGNAGGSTEDLSSLDEGPCIAGTGLSTLRRLENLRLDQLHQLRPIGTRGLKLPSLSHTGTTVSRRVGPPVSLERRSSSSSSISSAYTVSRRSSLASPFPPGSPPENGASSLPGLMPAQHYLLRARYASARGGGTSPTAASSLDRIGGLPMPPWRSRAEYPGYNPNAGVTRRASDPAQAADRPAPARVQRFKSLGCVHTPPTVAGGGQNFDPYLPTSVYSPQPPSITENAAMDARGLQEEPEVGTSMVGSGLNPYMDFPPTDTLGYGGPEGAAAEPYGARGPGSLPLGPGPPTNYGPNPCPQQASYPDPTQETWGEFPSHSGLYPGPKALGGTYSQCPRLEHYGQVQVKPEQGCPVGSDSTGLAPCLNAHPSEGPPHPQPLFSHYPQPSPPQYLQSGPYTQPPPDYLPSEPRPCLDFDSPTHSTGQLKAQLVCNYVQSQQELLWEGGGREDAPAQEPSYQSPKFLGGSQVSPSRAKAPVNTYGPGFGPNLPNHKSGSYPTPSPCHENFVVGANRASHRAAAPPRLLPPLPTCYGPLKVGGTNPSCGHPEVGRLGGGPALYPPPEGQVCNPLDSLDLDNTQLDFVAILDEPQGLSPPPSHDQRGSSGHTPPPSGPPNMAVGNMSVLLRSLPGETEFLNSSA

Research Backgrounds

Function:

Acts as a transcriptional activator. Binds to the DNA consensus sequence 5'-GACCACCCA-3'. Regulates the transcription of specific genes during normal development. Plays a role in craniofacial development and digital development, as well as development of the central nervous system and gastrointestinal tract. Mediates SHH signaling. Plays a role in cell proliferation and differentiation via its role in SHH signaling.

Acts as a transcriptional activator, but activates a different set of genes than isoform 1. Activates expression of CD24, unlike isoform 1. Mediates SHH signaling. Promotes cancer cell migration.

PTMs:

Phosphorylated in vitro by ULK3.

Acetylation at Lys-518 down-regulates transcriptional activity. Deacetylated by HDAC1.

Subcellular Location:

Cytoplasm. Nucleus.
Note: Tethered in the cytoplasm by binding to SUFU (PubMed:10806483). Activation and translocation to the nucleus is promoted by interaction with STK36 (PubMed:10806483). Phosphorylation by ULK3 may promote nuclear localization (PubMed:19878745). Translocation to the nucleus is promoted by interaction with ZIC1 (PubMed:11238441).

Cytoplasm. Nucleus.

Extracellular region or secreted Cytosol Plasma membrane Cytoskeleton Lysosome Endosome Peroxisome ER Golgi apparatus Nucleus Mitochondrion Manual annotation Automatic computational assertionSubcellular location
Tissue Specificity:

Detected in testis (at protein level). Testis, myometrium and fallopian tube. Also expressed in the brain with highest expression in the cerebellum, optic nerve and olfactory tract. Isoform 1 is detected in brain, spleen, pancreas, liver, kidney and placenta; isoform 2 is not detectable in these tissues.

Family&Domains:

Belongs to the GLI C2H2-type zinc-finger protein family.

Research Fields

· Environmental Information Processing > Signal transduction > cAMP signaling pathway.   (View pathway)

· Environmental Information Processing > Signal transduction > Hedgehog signaling pathway.   (View pathway)

· Human Diseases > Cancers: Overview > Pathways in cancer.   (View pathway)

· Human Diseases > Cancers: Specific types > Basal cell carcinoma.   (View pathway)

References

1). Berberine suppresses colorectal cancer progression by inducing ferroptosis-mediated energy metabolism disorders. Journal of advanced research, 2025 (PubMed: 41139018) [IF=11.4]

Application: WB    Species: Mouse    Sample:

Fig. 4. Gli1 validation as BBR's therapeutic target in CRC. (A) Architectural schematics of graph-driven omics prediction deep learning-based drug-target prediction platform. (B) Prioritized top 10 candidate pathways mediating BBR's pharmacological activity. (C) Molecular docking simulation of BBR and Gli1 protein crystals. (D) Kinetic binding profiles of BBR with Gli1 protein were analyzed by surface plasmon resonance assay, and the KD values were determined with a 1:1 kinetics binding model. (E) Thermodynamic stability of BBR with Gli1 protein was analyzed by cellular stability thermal assessment.

2). Bovine serum albumin-stabilized nano-delivery system potentiates targeted anti-angiogenic therapy and synergistic photo-immunotherapy to restrict lung cancer metastasis. Acta biomaterialia, 2026 (PubMed: 41937036) [IF=9.4]

3). Hedgehog pathway inhibition causes primary follicle atresia and decreases female germline stem cell proliferation capacity or stemness. Stem Cell Research & Therapy, 2019 (PubMed: 31277696) [IF=7.5]

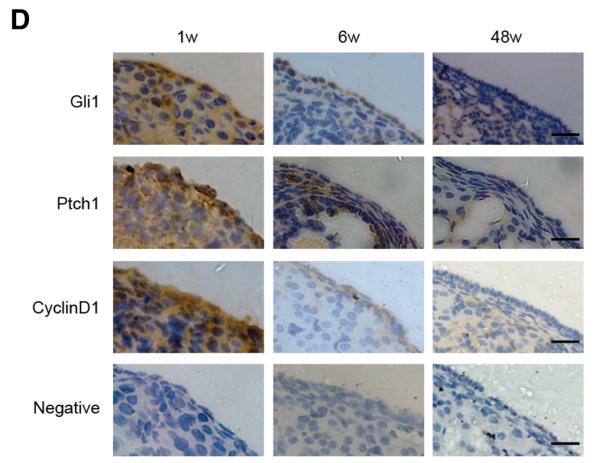
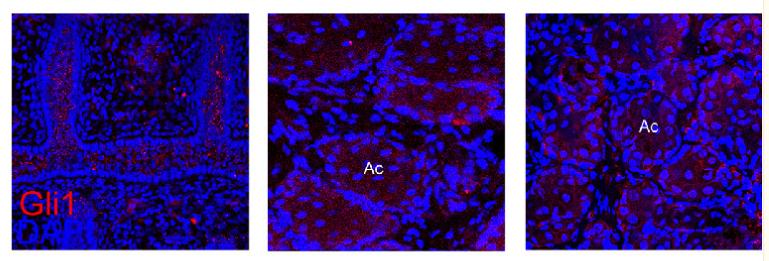
Application: IHC    Species: mouse    Sample: ovarian

Fig. 1 | Hh signaling pathway activity decreases with ovarian aging. a mRNA expression levels of Gli1, Ptch1, and Cyclin D1 in three mice of reproductive age. b, c Protein expression levels.d IHC detection of key members of the Hh pathway, Gli1, Ptch1, and Cyclin D1, in the OSE. Bar is 10 μm. *p < 0.05 and **p < 0.01

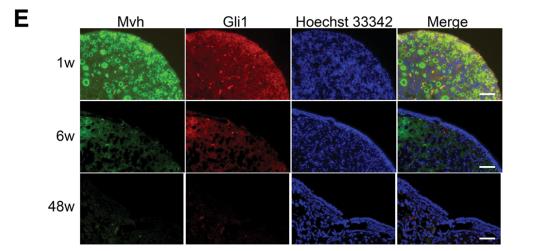
Application: IF/ICC    Species: mouse    Sample: ovarian

Fig. 2| Ovarian aging has a similar trend as the decrease in Hh activity. a mRNA levels of Mvh decrease gradually along with ovarian aging. bOct4 mRNA levels have the same trend as Mvh levels. c, d Protein levels of Mvh and Oct4 at three reproductive age points. e, f Dual-IF showed the coexpression of Mvh and Gli1, Oct4, and Gli1 in OSE. Bar is 20 μm. *p < 0.05 and **p < 0.01

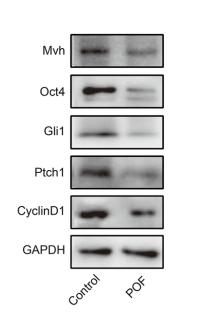
Application: WB    Species: mouse    Sample: ovarian

Fig. 3| Pathological ovaries exhibited a decline in Hh pathway activity. a HE staining of a normal ovary and POF ovary. Bar is 200 μm. b The ratio of atretic follicles of normal and POF ovaries. c IHC shows that the Mvh-positive follicles and FGSCs dramatically disappeared in the POF model;green arrows are FGSCs, and black arrow represents primordial follicles, the scale is 100 μm. d–f mRNA and protein expression levels of Mvh, Oct4, Gli1,Ptch1, and Cyclin D1. *p < 0.05 and **p < 0.01

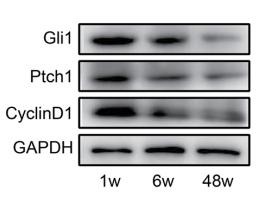
Application: WB    Species: mouse    Sample: ovaries

Fig. |1 Hh signaling pathway activity decreases with ovarian aging. a mRNA expression levels of Gli1, Ptch1, and Cyclin D1 in three mice of reproductive age. b, c Protein expression levels.

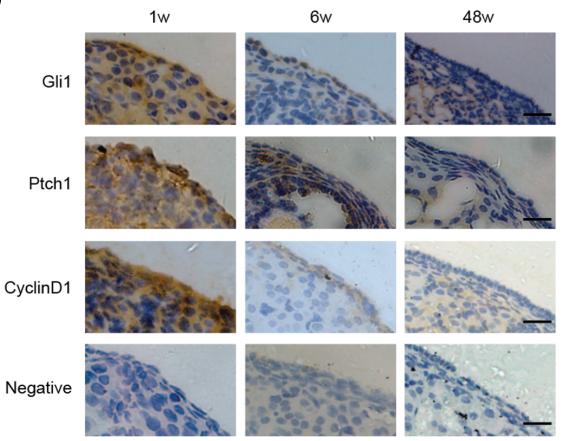
Application: IHC    Species: mouse    Sample: ovaries

Fig. |1 Hh signaling pathway activity decreases with ovarian aging. a mRNA expression levels of Gli1, Ptch1, and Cyclin D1 in three mice of reproductive age. b, c Protein expression levels.d IHC detection of key members of the Hh pathway, Gli1, Ptch1, and Cyclin D1, in the OSE. Bar is 10 μm. *p < 0.05 and **p < 0.01

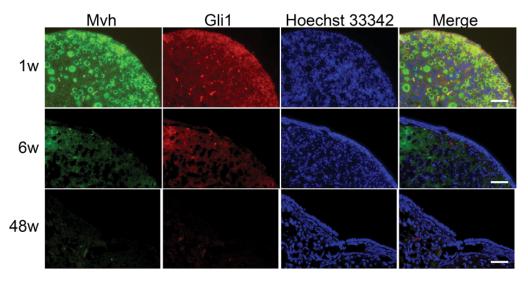
Application: IF/ICC    Species: mouse    Sample: ovaries

Fig. 2 |Ovarian aging has a similar trend as the decrease in Hh activity. a mRNA levels of Mvh decrease gradually along with ovarian aging. bOct4 mRNA levels have the same trend as Mvh levels. c, d Protein levels of Mvh and Oct4 at three reproductive age points. e, f Dual-IF showed the coexpression of Mvh and Gli1, Oct4, and Gli1 in OSE. Bar is 20 μm. *p < 0.05 and **p < 0.01

4). Merlin controls limb development and thumb formation by regulating primary cilium-hedgehog signaling. Cell reports, 2025 (PubMed: 40503937) [IF=7.5]

Application: WB    Species: Mouse    Sample:

Figure 3 Merlin deficiency impairs HH signaling activation in vitro (A–D) Bulk RNA sequencing (RNA-seq) of Nf2f/f and Nf2f/f;Prx1-Cre primary chondrocytes. (A) Volcano plot highlighting HH targets (Ihh, Gli1, and Ptch1). (B) Gene Ontology (GO) enrichment analysis of differentially expressed genes (log2(FC) ≥ 2, Q ≤ 0.05). (C) Gene set enrichment analysis (GSEA) for HH target genes. (D) Heatmap of differentially expressed HH target genes, with Z scores for expression levels. (E–H) RT-qPCR analysis of Gli1 and Ptch1, normalized to Hprt1, with and without the treatment of IHH (E and F) or SAG (G and H). (I) Western blot for GLI1 and GLI2; β-actin was the control. (J) Dual-luciferase reporter assay of GLI activity in ATDC5 cells with control (shScr) or Nf2 knockdown (shNf2). (K) RT-qPCR of Mmp13, Col10, Opn, and Runx2 in differentiated primary chondrocytes of Nf2f/f, Nf2f/f;Prx1-Cre, and Nf2f/f;Prx1-Cre overexpressing constitutively active GLI2 (ΔN GLI2). (L and M) IF staining (L) and quantification (M) of MMP13 in the same groups. ES, enrichment Score; NES, normalized enrichment score; EV, empty vector; ΔN GLI2, GLI2 with the N-terminal amino acids 1–279 deleted, constitutively active form; shScr, scrambled shRNA; shNf2, shRNA targeting the Nf2 gene. Scale bars, 20 μm (L). Quantification data are presented as average ± SD; p values (t test) are indicated between the bars. n = 3 (A–D and J), n = 6 (E, F, and I), n = 4 (G, H, and K), and n = 5 (L and M) per group.

5). Inoscavin A, a pyrone compound isolated from a Sanghuangporus vaninii extract, inhibits colon cancer cell growth and induces cell apoptosis via the hedgehog signaling pathway. Phytomedicine, 2022 (PubMed: 35026508) [IF=6.7]

6). 4-Hydroxynonenal Promotes Colorectal Cancer Progression Through Regulating Cancer Stem Cell Fate. Antioxidants & redox signaling, 2025 (PubMed: 39264845) [IF=5.9]

7). Resveratrol Plays a Protective Role against Premature Ovarian Failure and Prompts Female Germline Stem Cell Survival. International Journal of Molecular Sciences, 2019 (PubMed: 31340581) [IF=5.6]

8). Effects of metformin on Sonic hedgehog subgroup medulloblastoma progression: In vitro and in vivo studies. Frontiers in Pharmacology, 2022 (PubMed: 36278239) [IF=5.6]

9). Gankyrin activates the hedgehog signalling to drive metastasis in osteosarcoma. JOURNAL OF CELLULAR AND MOLECULAR MEDICINE, 2021 (PubMed: 34089292) [IF=5.3]

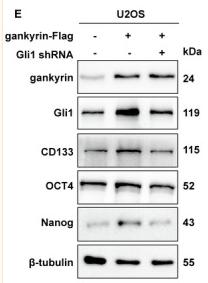
Application: WB    Species: Human    Sample: U2OS cells

FIGURE 3 Gankyrin promotes invasion, migration and regulates the expression of some stemness factors by up‐regulating Gli1. A, Gankyrin knockdown in U2OS cells reduced the mRNA expression of Gli1 and Ptch1 but not of β‐catenin and AXIN2, as shown by qRT‐PCR analysis. ns, P ≥ .05; *P < .05. B, Overexpression of gankyrin in MG63 cells increased the mRNA expression of Gli1 and Ptch1 but not of β‐catenin and AXIN2. ns, P ≥ .05; **P < .01. C, Gankyrin depletion in U2OS cells diminished the protein levels of Gli1 and PTCH1, as detected by western blot analysis. D, Ectopic expression of gankyrin in MG63 cells induced the protein levels of Gli1 and PTCH1. E, The up‐regulation of stem cell markers, including CD133, OCT4, and Nanog, following gankyrin overexpression was attenuated by Gli1 shRNA in U2OS cells, as detected by Western blot analysis. F, The increase in cell migration with gankyrin overexpression was attenuated by Gli1 shRNA in U2OS cells, as shown by wound healing assays. *P < .05; **P < .01. G, The increase in cell migration with gankyrin overexpression was attenuated by Gli1 shRNA in U2OS cells, as shown by Transwell invasion assays. *P < .05

10). Hedgehog Signaling Pathway Regulates the Proliferation and Differentiation of Rat Meibomian Gland Epithelial Cells. Investigative Ophthalmology & Visual Science, 2021 (PubMed: 33616621) [IF=5.0]

Application: IF/ICC    Species: Rat    Sample: epithelial cells

Figure 1. Expression of Hedgehog receptor and downstream molecules in rat meibomian glands. (A) At P3, Smo was broadly expressed in almost all epithelial cells. By 6 weeks, Smo was expressed in all acini, and by 12 weeks, the expression of Smo in acini were generally low. (B) Gli1 was expressed in the cytoplasm of meibomian glands at 3 days, 6 weeks, and 12 weeks old. (C) Gli2 was highly expressed in the cytoplasm at 3 days old, but by 6 weeks and 12 weeks, the expression was almost absent. (D) Gli3 was hardly expressed at 3 days, 6 weeks, and 12 weeks. Du, duct; Ac, acinus.

Load more

Restrictive clause


Affinity Biosciences tests all products strictly. Citations are provided as a resource for additional applications that have not been validated by Affinity Biosciences. Please choose the appropriate format for each application and consult Materials and Methods sections for additional details about the use of any product in these publications.

For Research Use Only.
Not for use in diagnostic or therapeutic procedures. Not for resale. Not for distribution without written consent. Affinity Biosciences will not be held responsible for patent infringement or other violations that may occur with the use of our products. Affinity Biosciences, Affinity Biosciences Logo and all other trademarks are the property of Affinity Biosciences LTD.