Product: SMCR7/MID49 Antibody
Catalog: DF12044
Description: Rabbit polyclonal antibody to SMCR7/MID49
Application: WB IHC IF/ICC
Reactivity: Human, Mouse, Rat, Monkey
Prediction: Horse
Mol.Wt.: 49 kDa; 49kD(Calculated).
Uniprot: Q96C03
RRID: AB_2844849

View similar products>>

   Size Price Inventory
 100ul $280 In stock
 200ul $350 In stock

Lead Time: Same day delivery

For pricing and ordering contact:
Local distributors

Product Info

Source:
Rabbit
Application:
WB 1:500-1:2000, IHC 1:50-1:200, IF/ICC 1:100-1:500
*The optimal dilutions should be determined by the end user.
*Tips:

WB: For western blot detection of denatured protein samples. IHC: For immunohistochemical detection of paraffin sections (IHC-p) or frozen sections (IHC-f) of tissue samples. IF/ICC: For immunofluorescence detection of cell samples. ELISA(peptide): For ELISA detection of antigenic peptide.

Reactivity:
Human,Mouse,Rat,Monkey
Prediction:
Horse(86%)
Clonality:
Polyclonal
Specificity:
SMCR7/MID49 Antibody detects endogenous levels of total SMCR7/MID49.
RRID:
AB_2844849
Cite Format: Affinity Biosciences Cat# DF12044, RRID:AB_2844849.
Conjugate:
Unconjugated.
Purification:
The antiserum was purified by peptide affinity chromatography using SulfoLink™ Coupling Resin (Thermo Fisher Scientific).
Storage:
Rabbit IgG in phosphate buffered saline , pH 7.4, 150mM NaCl, 0.02% sodium azide and 50% glycerol. Store at -20 °C. Stable for 12 months from date of receipt.
Alias:

Fold/Unfold

MGC23130; MID49; MID49_HUMAN; MIEF2; Mitochondrial dynamic protein MID49; Mitochondrial dynamic protein of 49 kDa; Mitochondrial dynamics protein MID49; Mitochondrial dynamics protein of 49 kDa; Mitochondrial elongation factor 2; Smith Magenis syndrome chromosome region candidate 7; Smith-Magenis syndrome chromosomal region candidate gene 7 protein;

Immunogens

Immunogen:
Uniprot:
Gene(ID):
Expression:
Q96C03 MID49_HUMAN:

Expressed in all tissues tested with highest expression in heart and skeletal muscle.

Sequence:
MAEFSQKRGKRRSDEGLGSMVDFLLANARLVLGVGGAAVLGIATLAVKRFIDRATSPRDEDDTKADSWKELSLLKATPHLQPRPPPAALSQPVLPLAPSSSAPEGPAETDPEVTPQLSSPAPLCLTLQERLLAFERDRVTIPAAQVALAKQLAGDIALELQAYFRSKFPELPFGAFVPGGPLYDGLQAGAADHVRLLVPLVLEPGLWSLVPGVDTVARDPRCWAVRRTQLEFCPRGSSPWDRFLVGGYLSSRVLLELLRKALAASVNWPAIGSLLGCLIRPSMASEELLLEVQHERLELTVAVLVAVPGVDADDRLLLAWPLEGLAGNLWLQDLYPVEAARLRALDDHDAGTRRRLLLLLCAVCRGCSALGQLGRGHLTQVVLRLGEDNVDWTEEALGERFLQALELLIGSLEQASLPCHFNPSVNLFSSLREEEIDDIGYALYSGLQEPEGLL

Predictions

Predictions:

Score>80(red) has high confidence and is suggested to be used for WB detection. *The prediction model is mainly based on the alignment of immunogen sequences, the results are for reference only, not as the basis of quality assurance.

Species
Results
Score
Horse
86
Pig
71
Bovine
71
Dog
71
Chicken
58
Rabbit
57
Sheep
0
Xenopus
0
Zebrafish
0
Model Confidence:
High(score>80) Medium(80>score>50) Low(score<50) No confidence

PTMs - Q96C03 As Substrate

Site PTM Type Enzyme
K7 Ubiquitination
S13 Phosphorylation
K64 Ubiquitination
K69 Ubiquitination
Y163 Phosphorylation
K167 Ubiquitination

Research Backgrounds

Function:

Mitochondrial outer membrane protein which regulates mitochondrial organization. It is required for mitochondrial fission and promotes the recruitment and association of the fission mediator dynamin-related protein 1 (DNM1L) to the mitochondrial surface independently of the mitochondrial fission FIS1 and MFF proteins. Regulates DNM1L GTPase activity.

Subcellular Location:

Mitochondrion outer membrane>Single-pass membrane protein.
Note: Colocalizes with DNM1L at mitochondrial membrane. Forms foci and rings around mitochondria.

Extracellular region or secreted Cytosol Plasma membrane Cytoskeleton Lysosome Endosome Peroxisome ER Golgi apparatus Nucleus Mitochondrion Manual annotation Automatic computational assertionSubcellular location
Tissue Specificity:

Expressed in all tissues tested with highest expression in heart and skeletal muscle.

Subunit Structure:

Interacts with DNM1L.

Family&Domains:

Belongs to the MID49/MID51 family.

References

1). Secreted Frizzled-Related Protein 5 Protects Against Cardiac Rupture and Improves Cardiac Function Through Inhibiting Mitochondrial Dysfunction. Frontiers in Cardiovascular Medicine, 2021 (PubMed: 34568442) [IF=2.8]

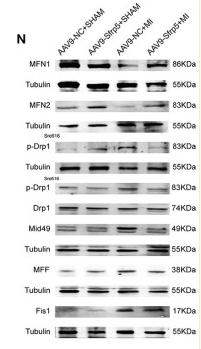
Application: WB    Species: Mouse    Sample: Heart tissue

Figure 4 Sfrp5 decreased apoptosis and improved mitochondrial dysfunction. (A) Cardiomyocyte apoptosis determined by TUNEL staining. Scale bars = 25 μm. (B) Statistical analysis of TUNEL-positive cells (values are presented as mean ± SD, n = 6 per group). (C) Protein expression of Bax and Bcl-2 in mouse hearts at 14 days after MI. (D) Quantitative analysis of the relative Bcl-2/Bax ratio (n = 5 per group). (E) Macrophage infiltration determined by immunohistochemistry. Scale bars = 50 μm. (F) Statistical analysis of F4/80-positive cells (values are presented as mean ± SD, n = 6 per group). (G) IL1β mRNA expression (n = 6 per group). β-Actin was used as a loading control (values are presented as mean ± SD, n = 6 per group). (H) Quantitative analysis of the NADH oxidase activity level (values are presented as mean ± SD, n = 6 per group). (I) Quantitative analysis of the ATP level (values are presented as mean ± SD, n = 6 per group). (J) Quantitative analysis of the NAD+/NADH ratio (values are presented as mean ± SD, n = 5–6 per group). (K) Mitochondrial morphology was detected by TEM. Scale bars = 1 μm. (L) Quantitative analysis of the size of the mitochondria (values are presented as mean ± SD, n = 6 per group). (M) Quantitative analysis of the mitochondrial number/total area (values are presented as mean ± SD, n = 6 per group). (N) Protein expression of mitochondrial fusion proteins (MFN1 and MFN2) and mitochondrial fission proteins (p-Drp1Ser616, p-Drp1Ser616/Drp, Mid49, MFF, and Fis1) in mouse hearts at 14 days after MI (n = 5 per group). (O) Quantitative analysis of the relative MFN1 protein expression. Tubulin was used as a loading control. (P) Quantitative analysis of the relative MFN2 protein expression. Tubulin was used as a loading control. (Q) Quantitative analysis of the relative p-Drp1Ser616. Tubulin was used as a loading control. (R) Quantitative analysis of the relative p-Drp1Ser616/Drp. (S) Quantitative analysis of the relative Mid49 protein expression. Tubulin was used as a loading control. (T) Quantitative analysis of the relative MFF protein expression. Tubulin was used as a loading control. (U) Quantitative analysis of the relative Fis1 protein expression. Tubulin was used as a loading control. *p < 0.05 AAV9-NC-MI mice at 14 days after MI vs. AAV9-Sfrp5-MI mice at 14 days after MI. **p < 0.01 AAV9-NC-MI mice at 14 days after MI vs. AAV9-Sfrp5-MI mice at 14 days after MI. ***p < 0.001 AAV9-NC-MI mice at 14 days after MI vs. AAV9-Sfrp5-MI mice at 14 days after MI.

2). Interval and continuous exercise overcome memory deficits related to β-Amyloid accumulation through modulating mitochondrial dynamics. BEHAVIOURAL BRAIN RESEARCH, 2019 (PubMed: 31445975) [IF=2.6]

Application: WB    Species: mouse    Sample: hippocampus

Fig. 5.| HIIT and MICT ameliorated mitochondrial fission and fusion in the hippocampus of APP/PS1 transgenic mice. The levels of DRP1 (a), FIS1 (b), MFF (c),MID49 (d), MID51 (e), MFN1 (f), MFN2 (g) and OPA1 (h) were detected in the hippocampus.

3). M1 Microglia Induced Neuronal Injury on Ischemic Stroke via Mitochondrial Crosstalk between Microglia and Neurons. Oxidative Medicine and Cellular Longevity, 2022 (PubMed: 36478988)

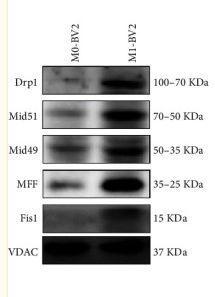
Application: WB    Species: Mouse    Sample: M0-BV2 and M1-BV2 cells

Figure 3 Mitochondrial changes in activated microglia (M1). (a) Schematic diagram of intracellular mitochondrial fusion and fission process in microglia after OGD/R. (b) Western blot assay of mitochondrial fusion protein (Opa1 and Mfn1), TOM20, and cytochrome c in mitochondria of M0 and M1 microglia (n = 3). Results are displayed in a form of mean ± SD; ∗P < 0.05, ∗∗P < 0.01, and ∗∗∗P < 0.001. (c) Western blotting findings of mitochondrial fission protein including MFF, Fis1, Mid49, and Mid51 in mitochondria of M0 and M1 microglia (n = 3). Data presented are mean ± SD; ∗∗P < 0.01 and ∗∗∗P < 0.001. (d) Mitochondrial function in M1 microglia and M0 microglia was investigated by determining ATP (n = 3), mitochondria membrane potential (n = 3), and ROS (n = 3). The relative ratio of intracellular ATP was determined by calculating the ratio of level of ATP in M0-BV2 and M1-BV2 cells to level of ATP in M0-BV2 cells. Results are displayed in a form of mean ± SD. ∗∗P < 0.01 and ∗∗∗P < 0.001. (e) Morphology of intracellular mitochondria in BV2 cells visualized under TEM, scale bar: 1.0 μm.

Restrictive clause


Affinity Biosciences tests all products strictly. Citations are provided as a resource for additional applications that have not been validated by Affinity Biosciences. Please choose the appropriate format for each application and consult Materials and Methods sections for additional details about the use of any product in these publications.

For Research Use Only.
Not for use in diagnostic or therapeutic procedures. Not for resale. Not for distribution without written consent. Affinity Biosciences will not be held responsible for patent infringement or other violations that may occur with the use of our products. Affinity Biosciences, Affinity Biosciences Logo and all other trademarks are the property of Affinity Biosciences LTD.