Product: beta-Tubulin Antibody
Catalog: T0023
Description: Mouse monoclonal antibody to beta-Tubulin
Application: WB IHC IF/ICC ELISA
Cited expt.: WB
Reactivity: Human, Mouse, Rat, Sheep, Rabbit, Dog, Monkey, Hamster, Chicken
Mol.Wt.: 55KD; 50kD(Calculated).
Uniprot: P07437
RRID: AB_2813772

View similar products>>

   Size Price Inventory
 50ul $150 In stock
 100ul $250 In stock
 200ul $350 In stock
 1ml $1200 In stock

Lead Time: Same day delivery

For pricing and ordering contact:
Local distributors

Product Info

Source:
Mouse
Application:
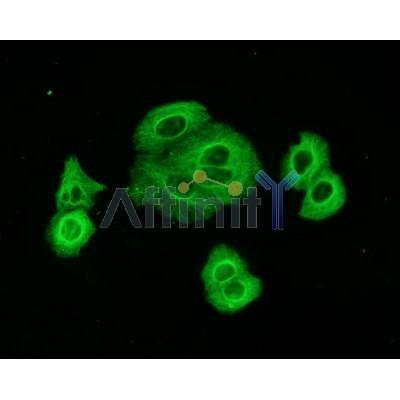
WB 1:10000-1:500000, IHC 1:50-1:200, IF/ICC: 1:200
*The optimal dilutions should be determined by the end user. For optimal experimental results, antibody reuse is not recommended.
*Tips:

WB: For western blot detection of denatured protein samples. IHC: For immunohistochemical detection of paraffin sections (IHC-p) or frozen sections (IHC-f) of tissue samples. IF/ICC: For immunofluorescence detection of cell samples. ELISA(peptide): For ELISA detection of antigenic peptide.

Reactivity:
Human,Mouse,Rat,Sheep,Rabbit,Dog,Monkey,Hamster,Chicken
Clonality:
Monoclonal [AFfirm039]
Specificity:
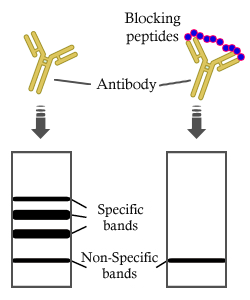
beta-Tubulin Mouse Monoclonal antibody detects endogenous levels of total beta-Tubulin protein.
RRID:
AB_2813772
Cite Format: Affinity Biosciences Cat# T0023, RRID:AB_2813772.
Conjugate:
Unconjugated.
Purification:
Affinity-chromatography.
Storage:
Mouse IgG1 in phosphate buffered saline (without Mg2+ and Ca2+), pH 7.4, 150mM NaCl. Store at -20 °C. Stable for 12 months from date of receipt.
Alias:

Fold/Unfold

TUBB3, CDCBM, Beta III Tubulin, Class III beta-tubulin, TUBB4, Tubulin, beta 3, Tubulin beta-III, Tubulin beta-3 chain, Tubulin beta-4 chain, Tubulin, beta 3 class III, CFEOM3A

Immunogens

Immunogen:

Full-length beta-tubulin protein of human.

Uniprot:
Gene(ID):
Expression:
P07437 TBB5_HUMAN:

Ubiquitously expressed with highest levels in spleen, thymus and immature brain.

Description:
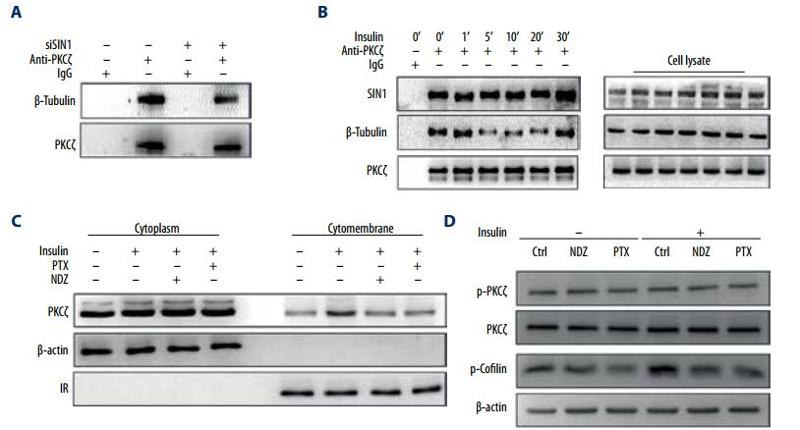
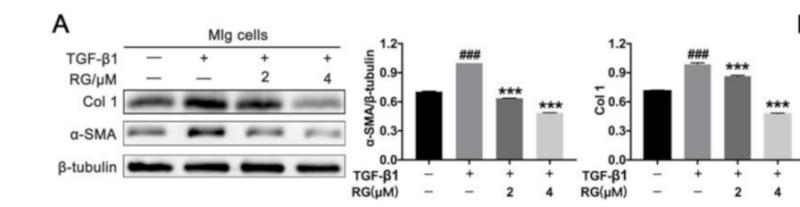
Microtubules are constituent parts of the mitotic apparatus, cilia, flagella, and elements of the cytoskeleton. They consist principally of 2 soluble proteins, alpha- and beta-tubulin, each of about 55,000 kDa. Antibodies against beta Tubulin are useful as loading controls for Western Blotting. However it should be noted that levels of beta-Tubulin may not be stable in certain cells. For example, expression of beta-Tubulin in adipose tissue is very low and therefore beta-Tubulin should not be used as loading control for these tissues.
Sequence:
MREIVHIQAGQCGNQIGAKFWEVISDEHGIDPTGTYHGDSDLQLDRISVYYNEATGGKYVPRAILVDLEPGTMDSVRSGPFGQIFRPDNFVFGQSGAGNNWAKGHYTEGAELVDSVLDVVRKEAESCDCLQGFQLTHSLGGGTGSGMGTLLISKIREEYPDRIMNTFSVVPSPKVSDTVVEPYNATLSVHQLVENTDETYCIDNEALYDICFRTLKLTTPTYGDLNHLVSATMSGVTTCLRFPGQLNADLRKLAVNMVPFPRLHFFMPGFAPLTSRGSQQYRALTVPELTQQVFDAKNMMAACDPRHGRYLTVAAVFRGRMSMKEVDEQMLNVQNKNSSYFVEWIPNNVKTAVCDIPPRGLKMAVTFIGNSTAIQELFKRISEQFTAMFRRKAFLHWYTGEGMDEMEFTEAESNMNDLVSEYQQYQDATAEEEEDFGEEAEEEA

Research Backgrounds

Function:

Tubulin is the major constituent of microtubules. It binds two moles of GTP, one at an exchangeable site on the beta chain and one at a non-exchangeable site on the alpha chain.

PTMs:

Some glutamate residues at the C-terminus are polyglutamylated, resulting in polyglutamate chains on the gamma-carboxyl group. Polyglutamylation plays a key role in microtubule severing by spastin (SPAST). SPAST preferentially recognizes and acts on microtubules decorated with short polyglutamate tails: severing activity by SPAST increases as the number of glutamates per tubulin rises from one to eight, but decreases beyond this glutamylation threshold.

Some glutamate residues at the C-terminus are monoglycylated but not polyglycylated due to the absence of functional TTLL10 in human. Monoglycylation is mainly limited to tubulin incorporated into axonemes (cilia and flagella). Both polyglutamylation and monoglycylation can coexist on the same protein on adjacent residues, and lowering glycylation levels increases polyglutamylation, and reciprocally. The precise function of monoglycylation is still unclear (Probable).

Phosphorylated on Ser-172 by CDK1 during the cell cycle, from metaphase to telophase, but not in interphase. This phosphorylation inhibits tubulin incorporation into microtubules.

Subcellular Location:

Cytoplasm>Cytoskeleton.

Extracellular region or secreted Cytosol Plasma membrane Cytoskeleton Lysosome Endosome Peroxisome ER Golgi apparatus Nucleus Mitochondrion Manual annotation Automatic computational assertionSubcellular location
Tissue Specificity:

Ubiquitously expressed with highest levels in spleen, thymus and immature brain.

Family&Domains:

The highly acidic C-terminal region may bind cations such as calcium.

Belongs to the tubulin family.

Research Fields

· Cellular Processes > Transport and catabolism > Phagosome.   (View pathway)

· Cellular Processes > Cellular community - eukaryotes > Gap junction.   (View pathway)

· Human Diseases > Infectious diseases: Bacterial > Pathogenic Escherichia coli infection.

References

1). PRMT1-methylated MSX1 phase separates to control palate development. Nature communications, 2025 (PubMed: 39843447) [IF=16.6]

Application: WB    Species: zebrafish    Sample:

Fig. 5: Abnormal MSX1 phase separation underlies cleft palate. A Sequence alignment of MSX1 orthologs in indicated vertebrates assessing the conservation of the PRMT1 methylation sites. B–G Control MO and prmt1 MO zebrafish embryos. B Representative images of phh3 staining in zebrafish embryos (left) and quantification of phh3-positive cells in the ethmoid palate region of zebrafish embryos (right). Scale bars, 100 μm. n = 10 embryos. The white dashed line indicates the ethmoid palate. C Representative fluorescence ventral views of zebrafish embryos. The white solid line indicates the ethmoid palate. Scale bars, 500 μm. D Representative Alcian blue staining images of zebrafish embryos. The red dashed line indicates the ethmoid palate. Scale bars, 500 μm. E Quantification of the cleft palate rates in zebrafish embryos. n = 3 biologically independent experiments. F Representative images of zebrafish embryos expressing GFP-tagged MSX1 at 12 hpf in the ethmoid palate region. Scale bars, 20 μm. G Quantification of the circularity of MSX1 condensates in ethmoid palate region from zebrafish embryos. control: n = 152, prmt1 MO: n = 147 condensates. H–L Control MO, msx1 MO, and msx1 MO + PRMT1 mRNA zebrafish embryos. H Immunofluorescence staining images of phh3 in zebrafish embryos. The white dashed line indicates the ethmoid palate. Scale bars, 100 μm. I Quantitative analysis of phh3-positive cells in the ethmoid palate region in zebrafish embryos. n = 27 embryos. J Fluorescence ventral views of zebrafish embryos. The white solid line indicates the ethmoid palate. Scale bars, 500 μm. K Alcian blue staining images of zebrafish embryos. The red dashed line indicates the ethmoid palate. Scale bars, 500 μm. L Quantification of the cleft palate rates in zebrafish embryos. n = 4 biologically independent experiments. M Representative western blot images of aDMA-MSX1 levels in zebrafish embryos microinjected with control and prmt1 MO. N Representative western blot images of aDMA-MSX1 levels in zebrafish embryos microinjected with MSX1-FL mRNA or its mutants, including R150S and R157S mRNA. O–S Control MO, msx1 MO, msx1 MO + FL mRNA, msx1 MO + R150S mRNA, and msx1 MO + R157S mRNA zebrafish embryos. O Representative immunofluorescence staining images of phh3 staining of zebrafish embryos. The white dashed line indicates the ethmoid palate. Scale bars, 100 μm. P Quantitative of phh3-positive cells in the ethmoid palate region in zebrafish embryos. n = 21 embryos. Q Representative fluorescence ventral views of zebrafish embryos. The white solid line indicates the ethmoid palate. Scale bars, 500 μm. R Representative Alcian blue staining images of zebrafish embryos. The red dashed line represents the ethmoid palate. Scale bars, 500 μm. S Quantification of the cleft palate rates in zebrafish embryos. n = 3 biologically independent experiments. MO: morpholino, hpf: hours post-fertilization. All data in this figure are represented as mean ± SD from at least three biologically independent experiments with similar results. Two-tailed Student’s t-test for (B, E, G, S), One-way ANOVA with Dunnett’s multiple comparisons test for (I, L), and Turkey’s multiple comparisons test for (P). Source data are provided as a Source Data file.

2). The clinical antiprotozoal drug nitazoxanide and its metabolite tizoxanide extend Caenorhabditis elegans lifespan and healthspan. Acta pharmaceutica Sinica. B, 2024 (PubMed: 39027239) [IF=14.7]

3). Magnetic sculpture-like tumor cell vaccines enable targeted in situ immune activation and potent antitumor effects. Theranostics, 2025 (PubMed: 40303352) [IF=12.4]

4). ALKBH5 regulates cardiomyocyte proliferation and heart regeneration by demethylating the mRNA of YTHDF1. Theranostics, 2021 (PubMed: 33456585) [IF=12.4]

Application: WB    Species: mouse    Sample: cardiomyocytes

Figure 8.| ALKBH5 upregulates the mRNA stability of YTHDF1 in turn promotes the translation of YAP. (A) m6A-meRIP-qPCR of YTHDF1 in CTL or ALKBH5 OE P1 CMs (***P < 0.001, n = 4). (B) RT-qPCR analysis of YTHDF1 in cultured P1 cardiomyocytes transfected with control or ALKBH5 OE plasmid (**P < 0.01, n = 4). (C) RT-qPCR analysis of YTHDF1 in cultured P1 cardiomyocytes transfected with control siRNA or ALKBH5 siRNAs (*P < 0.05, n = 4). (D) Western blot analysis of ALKBH5 and YTHDF1 in cultured P1 cardiomyocytes transfected with control or ALKBH5 OE plasmid.

5). Exercise-derived peptide protects against pathological cardiac remodeling. EBioMedicine, 2022 (PubMed: 35843176) [IF=9.7]

6). Point-of-care bone cement based on natural peptide comonomer protects orthopaedic implants from bacterial challenge. Materials today. Bio, 2025 (PubMed: 41127548) [IF=8.7]

7). Free CA125 promotes ovarian cancer cell migration and tumor metastasis by binding Mesothelin to reduce DKK1 expression and activate the SGK3/FOXO3 pathway. International Journal of Biological Sciences, 2023 (PubMed: 33613114) [IF=8.2]

Application: WB    Species: Human    Sample: A2780 and OVCAR3 cells

Figure 2 CA125 downregulates DKK1 expression in ovarian cancer cells. qPCR (A-B), ELISA (C-D), and Western blot (E-F) analysis of DKK1 mRNA levels in A2780 and OVCAR3 cells treated with CA125 at 0, 0.2. and 0.4 µg/mL for 48 h. The results represent the mean ± SD. *p<0.05, **p<0.01, ****p<0.0001.

8). EGFR tyrosine kinase activity and Rab GTPases coordinate EGFR trafficking to regulate macrophage activation in sepsis. Cell Death & Disease, 2022 (PubMed: 36344490) [IF=8.1]

9). Imatinib inhibits pericyte-fibroblast transition and inflammation and promotes axon regeneration by blocking the PDGF-BB/PDGFRβ pathway in spinal cord injury. Inflammation and regeneration, 2022 (PubMed: 36163271) [IF=8.1]

Application: WB    Species: Mouse    Sample: bEnd.3 cells

Fig. 4 Endothelial PDGF-BB induces pericyte-fibroblast transition and extracellular matrix deposition in vitro. a The PDGF-BB expression levels in bEnd.3 cells treated with 1 mg/ml myelin debris at the indicated time points were measured by ELISA. b, c Western blot analysis (b) and quantification (c) of PDGF-BB in bEnd.3 cells treated as described above in a. d The PDGF-BB expression levels in bEnd.3 cells treated with the indicated concentrations of myelin debris for 72 h were measured by ELISA. e, f Western blot analysis (e) and quantification (f) of PDGF-BB in bEnd.3 cells treated as described above in d. g Experimental schematic diagram of pericyte phenotypic transition induced by culture medium (empty, control), EC-CM treated with PBS, Mye-CM treated with myelin debris, and PDGF-BB. h Immunostaining of PDGFRβ (red), pericyte marker NG2 (green, upper panel), and fibroblast markers FSP1 (green, middle panel) and vimentin (green, lower panel) in primary pericytes treated as in g. i Quantification of the percentage of NG2+, FSP1+, and vimentin+ pericytes. j, k Immunostaining and quantification of extracellular matrix collagen I (green, upper panel) and laminin (green, lower panel) in primary pericytes treated as described in g. The nuclei are stained blue with DAPI. l, m Western blot analysis (l) and quantification (m) of NG2, FSP1, and vimentin in primary pericytes treated as described above. n, o Western blot analysis (n) and quantification (o) of extracellular matrix collagen I and laminin in primary pericytes treated as described above. Scale bar: 25 μm (h and j). Data are expressed as mean ± s.e.m. n = 3 independent cultures. *p < 0.05, **p < 0.01, and ***p < 0.001 versus 0 h, 0 mg/ml or control by one-way ANOVA followed by Tukey’s post hoc test in a, c, d, f, i, k, m, and o

10). Knockdown of RUVBL2 improves hnRNPA2/B1-stress granules dynamics to inhibit perioperative neurocognitive disorders in aged mild cognitive impairment rats. Aging cell, 2025 (PubMed: 39610020) [IF=8.0]

Load more

Restrictive clause


Affinity Biosciences tests all products strictly. Citations are provided as a resource for additional applications that have not been validated by Affinity Biosciences. Please choose the appropriate format for each application and consult Materials and Methods sections for additional details about the use of any product in these publications.

For Research Use Only.
Not for use in diagnostic or therapeutic procedures. Not for resale. Not for distribution without written consent. Affinity Biosciences will not be held responsible for patent infringement or other violations that may occur with the use of our products. Affinity Biosciences, Affinity Biosciences Logo and all other trademarks are the property of Affinity Biosciences LTD.