


| Product: | EPHA2 Antibody |
| Catalog: | AF5238 |
| Description: | Rabbit polyclonal antibody to EPHA2 |
| Application: | WB IHC |
| Cited expt.: | WB, IHC |
| Reactivity: | Human, Mouse, Rat |
| Prediction: | Pig, Bovine, Horse, Sheep, Rabbit, Dog |
| Mol.Wt.: | 108 kDa(Observed); 108kD(Calculated). |
| Uniprot: | P29317 |
| RRID: | AB_2837724 |
Control Products

Related Downloads
Protocols
Product Info
*The optimal dilutions should be determined by the end user. For optimal experimental results, antibody reuse is not recommended.
*Tips:
WB: For western blot detection of denatured protein samples. IHC: For immunohistochemical detection of paraffin sections (IHC-p) or frozen sections (IHC-f) of tissue samples. IF/ICC: For immunofluorescence detection of cell samples. ELISA(peptide): For ELISA detection of antigenic peptide.
Cite Format: Affinity Biosciences Cat# AF5238, RRID:AB_2837724.
Fold/Unfold
ARCC2; AW545284; CTPA; CTPP1; CTRCT6; EC 2.7.10.1; Eck; Eph receptor A2; EPHA2; EPHA2_HUMAN; Ephrin receptor; Ephrin receptor EphA2; Ephrin type A receptor 2; Ephrin type-A receptor 2; Epithelial cell kinase; Epithelial cell receptor protein tyrosine kinase; Myk 2; Myk2; Sek 2; Sek2; Soluble EPHA2 variant 1; Tyrosine protein kinase receptor ECK; Tyrosine-protein kinase receptor ECK; Tyrosine-protein kinase receptor MPK-5; Tyrosine-protein kinase receptor SEK-2;
Immunogens
A synthesized peptide derived from human EPHA2, corresponding to a region within N-terminal amino acids.
Expressed in brain and glioma tissue and glioma cell lines (at protein level). Expressed most highly in tissues that contain a high proportion of epithelial cells, e.g. skin, intestine, lung, and ovary.
- P29317 EPHA2_HUMAN:
- Protein BLAST With
- NCBI/
- ExPASy/
- Uniprot
MELQAARACFALLWGCALAAAAAAQGKEVVLLDFAAAGGELGWLTHPYGKGWDLMQNIMNDMPIYMYSVCNVMSGDQDNWLRTNWVYRGEAERIFIELKFTVRDCNSFPGGASSCKETFNLYYAESDLDYGTNFQKRLFTKIDTIAPDEITVSSDFEARHVKLNVEERSVGPLTRKGFYLAFQDIGACVALLSVRVYYKKCPELLQGLAHFPETIAGSDAPSLATVAGTCVDHAVVPPGGEEPRMHCAVDGEWLVPIGQCLCQAGYEKVEDACQACSPGFFKFEASESPCLECPEHTLPSPEGATSCECEEGFFRAPQDPASMPCTRPPSAPHYLTAVGMGAKVELRWTPPQDSGGREDIVYSVTCEQCWPESGECGPCEASVRYSEPPHGLTRTSVTVSDLEPHMNYTFTVEARNGVSGLVTSRSFRTASVSINQTEPPKVRLEGRSTTSLSVSWSIPPPQQSRVWKYEVTYRKKGDSNSYNVRRTEGFSVTLDDLAPDTTYLVQVQALTQEGQGAGSKVHEFQTLSPEGSGNLAVIGGVAVGVVLLLVLAGVGFFIHRRRKNQRARQSPEDVYFSKSEQLKPLKTYVDPHTYEDPNQAVLKFTTEIHPSCVTRQKVIGAGEFGEVYKGMLKTSSGKKEVPVAIKTLKAGYTEKQRVDFLGEAGIMGQFSHHNIIRLEGVISKYKPMMIITEYMENGALDKFLREKDGEFSVLQLVGMLRGIAAGMKYLANMNYVHRDLAARNILVNSNLVCKVSDFGLSRVLEDDPEATYTTSGGKIPIRWTAPEAISYRKFTSASDVWSFGIVMWEVMTYGERPYWELSNHEVMKAINDGFRLPTPMDCPSAIYQLMMQCWQQERARRPKFADIVSILDKLIRAPDSLKTLADFDPRVSIRLPSTSGSEGVPFRTVSEWLESIKMQQYTEHFMAAGYTAIEKVVQMTNDDIKRIGVRLPGHQKRIAYSLLGLKDQVNTVGIPI
Predictions
Score>80(red) has high confidence and is suggested to be used for WB detection. *The prediction model is mainly based on the alignment of immunogen sequences, the results are for reference only, not as the basis of quality assurance.
High(score>80) Medium(80>score>50) Low(score<50) No confidence
Research Backgrounds
Receptor tyrosine kinase which binds promiscuously membrane-bound ephrin-A family ligands residing on adjacent cells, leading to contact-dependent bidirectional signaling into neighboring cells. The signaling pathway downstream of the receptor is referred to as forward signaling while the signaling pathway downstream of the ephrin ligand is referred to as reverse signaling. Activated by the ligand ephrin-A1/EFNA1 regulates migration, integrin-mediated adhesion, proliferation and differentiation of cells. Regulates cell adhesion and differentiation through DSG1/desmoglein-1 and inhibition of the ERK1/ERK2 (MAPK3/MAPK1, respectively) signaling pathway. May also participate in UV radiation-induced apoptosis and have a ligand-independent stimulatory effect on chemotactic cell migration. During development, may function in distinctive aspects of pattern formation and subsequently in development of several fetal tissues. Involved for instance in angiogenesis, in early hindbrain development and epithelial proliferation and branching morphogenesis during mammary gland development. Engaged by the ligand ephrin-A5/EFNA5 may regulate lens fiber cells shape and interactions and be important for lens transparency development and maintenance. With ephrin-A2/EFNA2 may play a role in bone remodeling through regulation of osteoclastogenesis and osteoblastogenesis.
(Microbial infection) Acts as a receptor for hepatitis C virus (HCV) in hepatocytes and facilitates its cell entry. Mediates HCV entry by promoting the formation of the CD81-CLDN1 receptor complexes that are essential for HCV entry and by enhancing membrane fusion of cells expressing HCV envelope glycoproteins.
Autophosphorylates. Phosphorylated on tyrosine upon binding and activation by EFNA1. Phosphorylated residues Tyr-588 and Tyr-594 are required for binding VAV2 and VAV3 while phosphorylated residues Tyr-735 and Tyr-930 are required for binding PI3-kinase p85 subunit (PIK3R1, PIK3R2 or PIK3R3). These phosphorylated residues are critical for recruitment of VAV2 and VAV3 and PI3-kinase p85 subunit which transduce downstream signaling to activate RAC1 GTPase and cell migration. Dephosphorylation of Tyr-930 by PTPRF prevents the interaction of EPHA2 with NCK1. Phosphorylated at Ser-897 by PKB; serum-induced phosphorylation which targets EPHA2 to the cell leading edge and stimulates cell migration. Phosphorylation by PKB is inhibited by EFNA1-activated EPHA2 which regulates PKB activity via a reciprocal regulatory loop. Phosphorylated at Ser-897 in response to TNF by RPS6KA1 and RPS6KA3; RPS6KA-EPHA2 signaling pathway controls cell migration. Phosphorylated at Ser-897 by PKA; blocks cell retraction induced by EPHA2 kinase activity. Dephosphorylated by ACP1.
Ubiquitinated by CHIP/STUB1. Ubiquitination is regulated by the HSP90 chaperone and regulates the receptor stability and activity through proteasomal degradation. ANKS1A prevents ubiquitination and degradation (By similarity).
Cell membrane>Single-pass type I membrane protein. Cell projection>Ruffle membrane>Single-pass type I membrane protein. Cell projection>Lamellipodium membrane>Single-pass type I membrane protein. Cell junction>Focal adhesion.
Note: Present at regions of cell-cell contacts but also at the leading edge of migrating cells (PubMed:19573808, PubMed:20861311). Relocates from the plasma membrane to the cytoplasmic and perinuclear regions in cancer cells (PubMed:18794797).
Expressed in brain and glioma tissue and glioma cell lines (at protein level). Expressed most highly in tissues that contain a high proportion of epithelial cells, e.g. skin, intestine, lung, and ovary.
Belongs to the protein kinase superfamily. Tyr protein kinase family. Ephrin receptor subfamily.
Research Fields
· Environmental Information Processing > Signal transduction > MAPK signaling pathway. (View pathway)
· Environmental Information Processing > Signal transduction > Ras signaling pathway. (View pathway)
· Environmental Information Processing > Signal transduction > Rap1 signaling pathway. (View pathway)
· Environmental Information Processing > Signal transduction > PI3K-Akt signaling pathway. (View pathway)
· Organismal Systems > Development > Axon guidance. (View pathway)
References
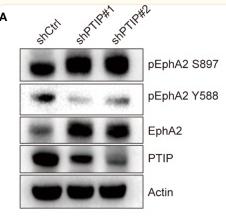
Application: WB Species: Sample: ESCC tumor sections
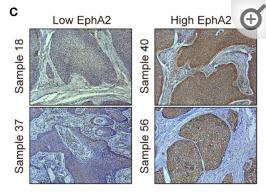
Application: IHC Species: Sample: ESCC tumor sections

Application: IHC Species: Human Sample: breast cancer

Application: WB Species: Human Sample: breast cancer
Restrictive clause
Affinity Biosciences tests all products strictly. Citations are provided as a resource for additional applications that have not been validated by Affinity Biosciences. Please choose the appropriate format for each application and consult Materials and Methods sections for additional details about the use of any product in these publications.
For Research Use Only.
Not for use in diagnostic or therapeutic procedures. Not for resale. Not for distribution without written consent. Affinity Biosciences will not be held responsible for patent infringement or other violations that may occur with the use of our products. Affinity Biosciences, Affinity Biosciences Logo and all other trademarks are the property of Affinity Biosciences LTD.