DDIT3/CHOP Antibody - #AF6277

 prevented tunicamycin (Tm)-induced endoplasmic reticulum stress (ERS). (a) is the representative imaging of Western blot")
 lung and b) plasma; c) mRNA expression of ghrelin in lung. Used control level of RNA as 1 and the other treatments relative to the control value (arbitrary units). * p < 0.05 vs. control; # p < 0.05 vs. OA; & p < 0.05 vs. OA + ghrelin. (n = 8 per group)")
 Representative protein levels of GRP78, active caspase-12, CHOP, and")
 production and ROS pathway related protein expressions. The 2′,7′-dich lorodihydrofluorescein diacetate assay was used for the detection of ROS in SW480 (A) and SW620 cells (B). ROS levels were significantly increased after DMA and 5-Fu treatment in both cell lines. The absolute intensity values of CHOP and Noxa were significantly different between cell lines (C). Results were obtained from three independent experiments and expressed as the means SD. Compared with SW480 (or SW620)")
 RT‑qPCR and (D) western blotting. A549 cells were transfected with GRP78‑siRNA or negative control, hyperoxia was established subsequently for 24, 48 and 72 h after transfection. Sham siRNA: A549 cells treated with negative control siRNA; siRNA+N: A549 cells were treated with GRP78‑siRNA and nomaxia for 24 h; siRNA+H 24 h, siRNA+H 48 h, siRNA+H 72 h: A549 cells were treated with GRP78‑siRNA and hyperoxia for 24, 48 and 72 h. CHOP protein expression was slightly increased after 24 h under hypoxia after (E and F) shamRNA treatment.")
.")

 Representative blots and histograms showing (B) p‑PERK/PERK ratio; (C) p‑eIF2α/eIF2α ratio; (D) ATF4 expression; and (E) CHOP expression.")
after TGF-β1 treatment.c–e Quantitative analysis of the relative protein level in (b).")
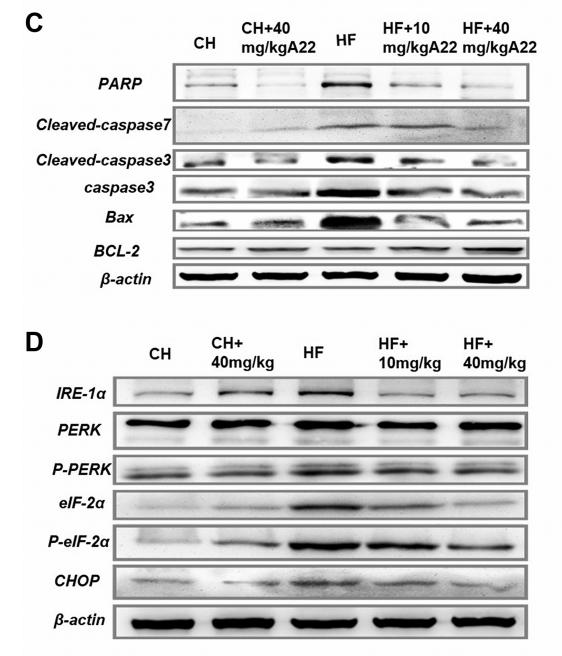
 Protein expression levels of CHOP, ATF6, p‑PERK, PERK, p‑IRE1,IRE1 and β‑actin in H9C2 cells treated with LPS, TA and TA + LPS, as determined by western blot analysis.")
 stress in the lacrimal gland. A: Transmission electron microscopy (TEM) showing the ultrastructure of the acinar cells of the lacrimal gland. Data are expressed as mean ± standard deviation (SD). *p<0.05, **p<0.001. Scale bars: (A) 5 μm, 2 μm. B: The deficiency of AQP5 protein induced endoplasmic reticulum stress in lacrimal glands of mice. Western blot bands for CHOP, GRP78, Caspase12, Bax, Bcl-2, and GAPDH (n = 3 samples). C: Quantified intensities of western blot bands for CHOP, GRP78, Caspase12, Bax, and Bcl-2 compared with GAPDH (n = 3 samples). *p<0.05, **p<0.01, *** p<0.0001.")
 Expressions of ER stress-associated proteins in HepG2 cells after treatment with 2 μM C20/C22 for 0, 6, 12, and 24 h. All proteins were normalized with the expression of Gapdh (n = 3). (C,D) Cells were stained with PI after 24 h of C20/C22 incubation, and flow cytometry was used to determine the proportion of cells in each stage of the cell cycle (n = 3). The reported data correspond to the mean ± SD of three independent experiments. The p-value was analyzed by one-way ANOVA followed by Tukey’s test using GraphPad Prism version 8.00. * p < 0.05, ** p < 0.01, *** p < 0.001, and **** p < 0.0001 vs. 0 h/control group.")
 Detection of MIN6 cell viability by CCK-8 assay. ( b ) Detection of MIN6 cell apoptosis using flow cytometry. ( c ) Detection of the GSIS-insulin level in MIN6 cells using ELISA. ( d ) Detection of the mRNA expression levels of TNF-α and IL-6 in MIN6 cells by qRT-PCR. ( e ) Detection of ROS production in MIN6 cells. ( f - h ) Detection of MDA, GSH, and SOD in MIN6 cells by ELISA. ( i ) Detection of the protein expression levels of CHOP and GRP78 in MIN6 cells by western blotting. Data were presented as mean±standard deviation. * p< 0.05 and ** p< 0.01 vs Control group; # p")


 GO analysis indicating that ER stress pathways significantly changed in the AS-treated group. (B) Real-time PCR analysis detecting the mRNA levels of IRE1 in MDA-MB-231 cells or 4T1 cells. (C) The mRNA level of IRE1 in MDA-MB-231 cells and 4T1 cells transfected with si-IRE1 was detected by real-time PCR. (D) Western blotting detecting the levels of total and phosphorylated IRE1, AKT, and p38 after treatment with AS with or without IRE1 knockdown. (E,F) Quantification of C. (G) Real-time PCR analysis detecting the mRNA levels of Ddit3 in 4T1 cells treated with AS with or without IRE1 knockdown. (H) Real-time PCR analysis detecting the mRNA levels of Ddit3 in 4T1 cells treated with AS in the absence or presence of SC79. AS, astragalin.")
| Product: | DDIT3/CHOP Antibody |
| Catalog: | AF6277 |
| Description: | Rabbit polyclonal antibody to DDIT3/CHOP |
| Application: | WB IHC IF/ICC |
| Cited expt.: | WB, IHC, IF/ICC |
| Reactivity: | Human, Mouse |
| Prediction: | Pig, Bovine, Horse, Sheep, Rabbit, Dog |
| Mol.Wt.: | 19~30kD(Observed); 19kD(Calculated). |
| Uniprot: | P35638 |
| RRID: | AB_2835130 |
Product Info
*The optimal dilutions should be determined by the end user. For optimal experimental results, antibody reuse is not recommended.
*Tips:
WB: For western blot detection of denatured protein samples. IHC: For immunohistochemical detection of paraffin sections (IHC-p) or frozen sections (IHC-f) of tissue samples. IF/ICC: For immunofluorescence detection of cell samples. ELISA(peptide): For ELISA detection of antigenic peptide.
Cite Format: Affinity Biosciences Cat# AF6277, RRID:AB_2835130.
Fold/Unfold
C/EBP homologous protein; C/EBP Homology Protein; C/EBP zeta; C/EBP-homologous protein 10; C/EBP-homologous protein; CCAAT/enhancer binding protein homologous protein; CEBPZ; CHOP 10; CHOP; CHOP-10; CHOP10; DDIT 3; DDIT-3; Ddit3; DDIT3_HUMAN; DNA Damage Inducible Transcript 3; DNA damage-inducible transcript 3 protein; GADD 153; GADD153; Growth Arrest and DNA Damage Inducible Protein 153; Growth arrest and DNA damage inducible protein GADD153; Growth arrest and DNA damage-inducible protein GADD153; MGC4154;
Immunogens
A synthesized peptide derived from human DDIT3, corresponding to a region within N-terminal amino acids.
- P35638 DDIT3_HUMAN:
- Protein BLAST With
- NCBI/
- ExPASy/
- Uniprot
MAAESLPFSFGTLSSWELEAWYEDLQEVLSSDENGGTYVSPPGNEEEESKIFTTLDPASLAWLTEEEPEPAEVTSTSQSPHSPDSSQSSLAQEEEEEDQGRTRKRKQSGHSPARAGKQRMKEKEQENERKVAQLAEENERLKQEIERLTREVEATRRALIDRMVNLHQA
Predictions
Score>80(red) has high confidence and is suggested to be used for WB detection. *The prediction model is mainly based on the alignment of immunogen sequences, the results are for reference only, not as the basis of quality assurance.
High(score>80) Medium(80>score>50) Low(score<50) No confidence
Research Backgrounds
Multifunctional transcription factor in ER stress response. Plays an essential role in the response to a wide variety of cell stresses and induces cell cycle arrest and apoptosis in response to ER stress. Plays a dual role both as an inhibitor of CCAAT/enhancer-binding protein (C/EBP) function and as an activator of other genes. Acts as a dominant-negative regulator of C/EBP-induced transcription: dimerizes with members of the C/EBP family, impairs their association with C/EBP binding sites in the promoter regions, and inhibits the expression of C/EBP regulated genes. Positively regulates the transcription of TRIB3, IL6, IL8, IL23, TNFRSF10B/DR5, PPP1R15A/GADD34, BBC3/PUMA, BCL2L11/BIM and ERO1L. Negatively regulates; expression of BCL2 and MYOD1, ATF4-dependent transcriptional activation of asparagine synthetase (ASNS), CEBPA-dependent transcriptional activation of hepcidin (HAMP) and CEBPB-mediated expression of peroxisome proliferator-activated receptor gamma (PPARG). Inhibits the canonical Wnt signaling pathway by binding to TCF7L2/TCF4, impairing its DNA-binding properties and repressing its transcriptional activity. Plays a regulatory role in the inflammatory response through the induction of caspase-11 (CASP4/CASP11) which induces the activation of caspase-1 (CASP1) and both these caspases increase the activation of pro-IL1B to mature IL1B which is involved in the inflammatory response.
Ubiquitinated, leading to its degradation by the proteasome.
Phosphorylation at serine residues by MAPK14 enhances its transcriptional activation activity while phosphorylation at serine residues by CK2 inhibits its transcriptional activation activity.
Cytoplasm. Nucleus.
Note: Present in the cytoplasm under non-stressed conditions and ER stress leads to its nuclear accumulation.
The N-terminal region is necessary for its proteasomal degradation, transcriptional activity and interaction with EP300/P300.
Belongs to the bZIP family.
Research Fields
· Cellular Processes > Cell growth and death > Apoptosis. (View pathway)
· Environmental Information Processing > Signal transduction > MAPK signaling pathway. (View pathway)
· Genetic Information Processing > Folding, sorting and degradation > Protein processing in endoplasmic reticulum. (View pathway)
· Human Diseases > Endocrine and metabolic diseases > Non-alcoholic fatty liver disease (NAFLD).
· Human Diseases > Cancers: Overview > Transcriptional misregulation in cancer.
References
Application: WB Species: mouse Sample: liver
Application: IHC Species: Mice Sample: ileum
Application: WB Species: Human Sample: HaCaT cells
Application: WB Species: Human Sample: HaCaT cells

Application: WB Species: human Sample: scleral tissue

Application: WB Species: Mouse Sample: N2a APPswe cells

Application: WB Species: mouse and human Sample: Hepa1-6 and HepG2 cells

Application: WB Species: Mouse Sample:
Restrictive clause
Affinity Biosciences tests all products strictly. Citations are provided as a resource for additional applications that have not been validated by Affinity Biosciences. Please choose the appropriate format for each application and consult Materials and Methods sections for additional details about the use of any product in these publications.
For Research Use Only.
Not for use in diagnostic or therapeutic procedures. Not for resale. Not for distribution without written consent. Affinity Biosciences will not be held responsible for patent infringement or other violations that may occur with the use of our products. Affinity Biosciences, Affinity Biosciences Logo and all other trademarks are the property of Affinity Biosciences LTD.