.
Bands result from membrane strip incubation.")
.
Bands result from membrane strip incubation.")
 production and ROS pathway related protein expressions. The 2′,7′-dich lorodihydrofluorescein diacetate assay was used for the detection of ROS in SW480 (A) and SW620 cells (B). ROS levels were significantly increased after DMA and 5-Fu treatment in both cell lines. The absolute intensity values of CHOP and Noxa were significantly different between cell lines (C). Results were obtained from three independent experiments and expressed as the means SD. Compared with SW480 (or SW620)")
 RT‑qPCR and (D) western blotting. A549 cells were transfected with GRP78‑siRNA or negative control, hyperoxia was established subsequently for 24, 48 and 72 h after transfection. Sham siRNA: A549 cells treated with negative control siRNA; siRNA+N: A549 cells were treated with GRP78‑siRNA and nomaxia for 24 h; siRNA+H 24 h, siRNA+H 48 h, siRNA+H 72 h: A549 cells were treated with GRP78‑siRNA and hyperoxia for 24, 48 and 72 h. CHOP protein expression was slightly increased after 24 h under hypoxia after (E and F) shamRNA treatment.")
.")

 Representative blots and histograms showing (B) p‑PERK/PERK ratio; (C) p‑eIF2α/eIF2α ratio; (D) ATF4 expression; and (E) CHOP expression.")
after TGF-β1 treatment.c–e Quantitative analysis of the relative protein level in (b).")
 Representative western blots.Results are expressed as the mean ± standard deviation. *P<0.05 vs. Con; #P<0.05 vs. the H/R group; &P<0.05 vs. The DEX+H/R group.")
 Protein expression levels of CHOP, ATF6, p-PERK, PERK, p-IRE1, IRE1 and β-actin in H9C2 cells treated with LPS, TA and TA + LPS, as determined by western blot analysis. Semi-quantification of the protein expression levels of (B) CHOP and ATF6, and (C) p-PERK, PERK and p-IRE1/IRE1 in the LPS, TA and TA + LPS groups. Data are presented as the mean ± SEM (n=3). *P<0.05 and **P<0.01 vs. control group; #P<0.05 vs. LPS group. TA, tannic acid; LPS, lipopolysaccharide; CHOP, C/EBP-homologous protein; ATF6, activating transcription factor 6; p, phosphorylated; PERK, protein kinase-like endoplasmic reticulum kinase; IRE1, inositol-requiring enzyme 1.")
 GRP78, (B) CHOP and (C) caspase-12, and protein expression levels of (D) GRP78, (E) CHOP and (F) caspase-12. (G) Representative western blots. Results are expressed as the mean ± standard deviation. *P<0.05 vs. Con; #P<0.05 vs. the H/R group; &P<0.05 vs. the DEX+H/R group. Con, control group; 1, normoxic incubation with DEX; 2, H/R incubation; 3, H/R incubation with dexmedetomidine; 4, normoxic incubation with 4-PBA; 5, H/R incubation with 4-PBA; 6, H/R incubation with DEX and 4-PBA; DEX, dexmedetomidine; GRP78, glucose-regulated protein 78; CHOP, C/EBP homologous protein; H/R, hypoxia/reoxygenation; 4-PBA, 4-phenylbutyric acid.")
 Representative western blots showed that GSK2606414 reduced the expression of CHOP, Bim, and cleaved caspase-3 in hippocampal tissue.")
 Representative blots of SIRT1, GRP78, p‑PERK, p‑eIF2α, CHOP and caspase‑12. Semiquantitative analysis of (B) SIRT1, (C) GRP78, (D) p‑PERK, (E) p‑eIF2α, (F) CHOP and (G) caspase‑12.")
 Levels of GRP78 and CHOP protein expression in Lv-Sig-1R cells and Lv-Ctrl cells.")
 Protein expression levels of CHOP, ATF6, p-PERK, PERK, p-IRE1, IRE1 and β-actin in H9C2 cells treated with LPS, TA and TA + LPS, as determined by western blot analysis. Semi-quantification of the protein expression levels of (B) CHOP and ATF6, and (C) p-PERK, PERK and p-IRE1/IRE1 in the LPS, TA and TA + LPS groups. Data are presented as the mean ± SEM (n=3). *P<0.05 and **P<0.01 vs. control group; #P<0.05 vs. LPS group. TA, tannic acid; LPS, lipopolysaccharide; CHOP, C/EBP-homologous protein; ATF6, activating transcription factor 6; p, phosphorylated; PERK, protein kinase-like endoplasmic reticulum kinase; IRE1, inositol-requiring enzyme 1.")
 Protein levels of ATF4, CHOP and p‑eIF2A/eIF2A were determined using western blotting. *P<0.05, **P<0.01 and ***P<0.001 vs. 0 mg/dl UA control group. FGF21, fibroblast growth factor 21; UA, uric acid; Sirt1,sirtuin 1; CHOP, eIF2A, eukaryotic initiation factor 2; ATF4, activating transcription factor 4; p‑, phosphorylated.")
 Representative western blots showed that GSK2606414 reduced the expression of CHOP, Bim, and cleaved caspase-3 in hippocampal tissue. The pooled data from three mice for each group are summarized in (b). (c) The western blot results showed that the expression of Bax and Bak in the mitochondria was obviously increased and that this effect was accompanied by a reduction in cytochrome c. These effects were prevented by the administration of GSK2606414. (d) Statistical data from three animals for each group are summarized. (e) Representative western blots showing that the cytoplasmic expression of Bax and Bak was obviously reduced and that of cytochrome C was significantly increased. GSK2606414 increased the expression of Bax and Bak and reduced cytochrome C. (f) Statistical data from three animals for each group are summarized. (g) The morphology of mitochondria in the hippocampal CA1 region in the (i) control group, (ii) GSK2606414 group, (iii) IH group, and (iv) IH + GSK2606414 group. In the control and GSK2606414 groups, intact mitochondria (indicated by arrowheads) with clear cristae were found. Much fewer cristae were found in the mitochondria from the IH group. GSK2606414 treatment preserved more intact mitochondria with discernable cristae. Scale bar: 0.25 μm. (h) The mitochondrial membrane potential (JC-1 fluorescence intensity ratio) was impaired by IH treatment and rescued by GSK2606414 treatment. ∗P < 0.05; ∗∗P < 0.01; ns: not significant.")
 on key proteins involved in endoplasmic reticulum stress in oleic acid-treated HepG2 cells.
Data are presented as mean ± SD. Different lowercase alphabet letters were significantly different at level of p < .05")
 Representative western blots showed that GSK2606414 reduced the expression of CHOP, Bim, and cleaved caspase-3 in hippocampal tissue. The pooled data from three mice for each group are summarized in (b). (c) The western blot results showed that the expression of Bax and Bak in the mitochondria was obviously increased and that this effect was accompanied by a reduction in cytochrome c. These effects were prevented by the administration of GSK2606414. (d) Statistical data from three animals for each group are summarized. (e) Representative western blots showing that the cytoplasmic expression of Bax and Bak was obviously reduced and that of cytochrome C was significantly increased. GSK2606414 increased the expression of Bax and Bak and reduced cytochrome C. (f) Statistical data from three animals for each group are summarized. (g) The morphology of mitochondria in the hippocampal CA1 region in the (i) control group, (ii) GSK2606414 group, (iii) IH group, and (iv) IH + GSK2606414 group. In the control and GSK2606414 groups, intact mitochondria (indicated by arrowheads) with clear cristae were found. Much fewer cristae were found in the mitochondria from the IH group. GSK2606414 treatment preserved more intact mitochondria with discernable cristae. Scale bar: 0.25 μm. (h) The mitochondrial membrane potential (JC-1 fluorescence intensity ratio) was impaired by IH treatment and rescued by GSK2606414 treatment. ∗P < 0.05; ∗∗P < 0.01; ns: not significant.")
 Representative blots of SIRT1, GRP78, p-PERK, p-eIF2α, CHOP and caspase-12. Semiquantitative analysis of (B) SIRT1, (C) GRP78, (D) p-PERK, (E) p-eIF2α, (F) CHOP and (G) caspase-12. (H) The mRNA levels of caspase-12 in the myocardium. Data are presented as the mean ± standard deviation. n=3. ##P<0.01 vs. Sham. *P<0.05 and **P<0.01 vs. MI/R. IOE, Inonotus obliquus extract; SIRT1, NAD-dependent protein deacetylase sirtuin-1; GRP78, glucose-regulated protein 78; PERK, protein kinase R-like endoplasmic reticulum kinase; eIF2α, eukaryotic translation initiation factor 2 subunit α; CHOP, C/EBP homologous protein; p, phosphorylated; MI/R, myocardial ischemia/reperfusion.")
 and C/EBP homologous protein (CHOP) in HK-2 cells were detected by western blot and quantitative real-time polymerase chain reaction (qRT-PCR). β-actin was used as a housekeeping gene. The results were expressed as the mean±standard deviation (SD) of three independent experiments.")
 Levels of insulin secretionby Lv-Sig-1R cells and Lv-Ctrl cells. (B) Levels of ATP production by Lv-Sig-1R cells and Lv-Ctrl cells. (C) Levels of GRP78 and CHOP protein expression in Lv-Sig-1R cells and Lv-Ctrl cells. (D) Expression of mitochondria-associated apoptotic proteins Bax, Bcl-2 and Cytochrome c in Lv-Sig-1R cells and Lv-Ctrl cells. The results are means ± SD for three observations; *P<0.05 and #P<0.05. ER, endoplasmic reticulum; GRP78, glucose-regulated protein 78; CHOP, C/EBP homologous protein; Sig-1R, Sigma-1 receptor; Lv, lentiviral; Ctrl, control; PA, palmitic acid.")
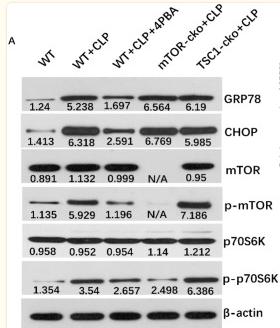
 patterns of mTOR pathway proteins, including mTOR, P-mTOR, downstream effectors p70s6k, p-p70s6k, 4EBP, and P-4EBP; (b) ERS-associated proteins, including GRP78 and CHOP; (c) apoptosis-associated proteins, including caspase-3, Bax, and Bcl-2. The protein expression was detected by immunoblotting. Data are mean ± SD. n = 4 biologically independent experiments (one-way ANOVA Tukey's post hoc test). ∗P < 0.05, ∗∗P < 0.01, and ∗∗∗P < 0.001.")
 and NeuN (red) immunofluorescence. B Statistical analysis of the fluorescence intensity of GRP78. C The expression of ER stress signaling-related proteins, including GRP78, ATF-6, p-PERK/PERK, and CHOP. D–G Expression histograms. ∗p")
 and CHOP (B) in mice kidney tissue Data are expressed as mean±SD, n=6, 200 or 400×). ##P")
 and CHOP (B) in mouse kidney tissue Data are expressed as mean±SD, n=6, 400×. ##P")
 staining for neuronal apoptosis. b Statistical analysis of the proportion of TUNEL-positive cells. c Expression levels of the ER stress-related apoptosis markers Caspase-12 and CHOP. d, e Protein expression levels. *P")
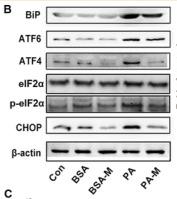
. C: the mRNA levels of ER stress-related genes were measured via quantitative PCR (n = 3, 1-way ANOVA with Duncan’s post hoc test). D: images of immunofluorescence staining of BiP in HUVECs in different groups. E: cellular ultrastructure in different groups. The arrow indicates endoplasmic reticulum. Data are shown as the means ± SD (*P < 0.05 vs. Con; **P < 0.01 vs. Con; #P < 0.05 vs. PA; ##P < 0.01 vs. PA). ATF-4, activating transcription factor 4; ATF-6, activating transcription factor 6; BiP, binding immunoglobulin protein; CHOP, C/EBP-homologous protein; ER, endoplasmic reticulum; HUVECs, human umbilical vein endothelial cells; MSCs, mesenchymal stem cells; PA, palmitic acid.")
 Representative western blot bands of GRP78, ATF4, CHOP, Cleaved caspase-12, PHLDA1, and PPARγ. n = 3. (B) The expression of CHOP in OGD/R-treated cells was detected by immunofluorescence staining. Red fluorescence: CHOP, blue fluorescence: nucleus.")
 Representative western blot bands of GRP78, ATF4, CHOP, Cleaved caspase-12, PHLDA1, and PPARγ. n = 3. (B) The expression of CHOP in OGD/R-treated cells was detected by immunofluorescence staining. Red fluorescence: CHOP, blue fluorescence: nucleus.")
| Product: | DDIT3/CHOP Antibody |
| Catalog: | DF6025 |
| Description: | Rabbit polyclonal antibody to DDIT3/CHOP |
| Application: | WB IHC IF/ICC |
| Cited expt.: | WB, IHC, IF/ICC |
| Reactivity: | Human, Mouse, Rat |
| Prediction: | Pig, Bovine, Sheep, Rabbit, Dog |
| Mol.Wt.: | 19~30kD(Observed); 19kD(Calculated). |
| Uniprot: | P35638 |
| RRID: | AB_2838000 |
Control Products

Related Downloads
Protocols
Product Info
*The optimal dilutions should be determined by the end user. For optimal experimental results, antibody reuse is not recommended.
*Tips:
WB: For western blot detection of denatured protein samples. IHC: For immunohistochemical detection of paraffin sections (IHC-p) or frozen sections (IHC-f) of tissue samples. IF/ICC: For immunofluorescence detection of cell samples. ELISA(peptide): For ELISA detection of antigenic peptide.
Cite Format: Affinity Biosciences Cat# DF6025, RRID:AB_2838000.
Fold/Unfold
C/EBP homologous protein; C/EBP Homology Protein; C/EBP zeta; C/EBP-homologous protein 10; C/EBP-homologous protein; CCAAT/enhancer binding protein homologous protein; CEBPZ; CHOP 10; CHOP; CHOP-10; CHOP10; DDIT 3; DDIT-3; Ddit3; DDIT3_HUMAN; DNA Damage Inducible Transcript 3; DNA damage-inducible transcript 3 protein; GADD 153; GADD153; Growth Arrest and DNA Damage Inducible Protein 153; Growth arrest and DNA damage inducible protein GADD153; Growth arrest and DNA damage-inducible protein GADD153; MGC4154;
Immunogens
A synthesized peptide derived from human DDIT3, corresponding to a region within N-terminal amino acids.
- P35638 DDIT3_HUMAN:
- Protein BLAST With
- NCBI/
- ExPASy/
- Uniprot
MAAESLPFSFGTLSSWELEAWYEDLQEVLSSDENGGTYVSPPGNEEEESKIFTTLDPASLAWLTEEEPEPAEVTSTSQSPHSPDSSQSSLAQEEEEEDQGRTRKRKQSGHSPARAGKQRMKEKEQENERKVAQLAEENERLKQEIERLTREVEATRRALIDRMVNLHQA
Predictions
Score>80(red) has high confidence and is suggested to be used for WB detection. *The prediction model is mainly based on the alignment of immunogen sequences, the results are for reference only, not as the basis of quality assurance.
High(score>80) Medium(80>score>50) Low(score<50) No confidence
Research Backgrounds
Multifunctional transcription factor in ER stress response. Plays an essential role in the response to a wide variety of cell stresses and induces cell cycle arrest and apoptosis in response to ER stress. Plays a dual role both as an inhibitor of CCAAT/enhancer-binding protein (C/EBP) function and as an activator of other genes. Acts as a dominant-negative regulator of C/EBP-induced transcription: dimerizes with members of the C/EBP family, impairs their association with C/EBP binding sites in the promoter regions, and inhibits the expression of C/EBP regulated genes. Positively regulates the transcription of TRIB3, IL6, IL8, IL23, TNFRSF10B/DR5, PPP1R15A/GADD34, BBC3/PUMA, BCL2L11/BIM and ERO1L. Negatively regulates; expression of BCL2 and MYOD1, ATF4-dependent transcriptional activation of asparagine synthetase (ASNS), CEBPA-dependent transcriptional activation of hepcidin (HAMP) and CEBPB-mediated expression of peroxisome proliferator-activated receptor gamma (PPARG). Inhibits the canonical Wnt signaling pathway by binding to TCF7L2/TCF4, impairing its DNA-binding properties and repressing its transcriptional activity. Plays a regulatory role in the inflammatory response through the induction of caspase-11 (CASP4/CASP11) which induces the activation of caspase-1 (CASP1) and both these caspases increase the activation of pro-IL1B to mature IL1B which is involved in the inflammatory response.
Ubiquitinated, leading to its degradation by the proteasome.
Phosphorylation at serine residues by MAPK14 enhances its transcriptional activation activity while phosphorylation at serine residues by CK2 inhibits its transcriptional activation activity.
Cytoplasm. Nucleus.
Note: Present in the cytoplasm under non-stressed conditions and ER stress leads to its nuclear accumulation.
The N-terminal region is necessary for its proteasomal degradation, transcriptional activity and interaction with EP300/P300.
Belongs to the bZIP family.
Research Fields
· Cellular Processes > Cell growth and death > Apoptosis. (View pathway)
· Environmental Information Processing > Signal transduction > MAPK signaling pathway. (View pathway)
· Genetic Information Processing > Folding, sorting and degradation > Protein processing in endoplasmic reticulum. (View pathway)
· Human Diseases > Endocrine and metabolic diseases > Non-alcoholic fatty liver disease (NAFLD).
· Human Diseases > Cancers: Overview > Transcriptional misregulation in cancer.
References
Application: WB Species: mouse Sample: liver
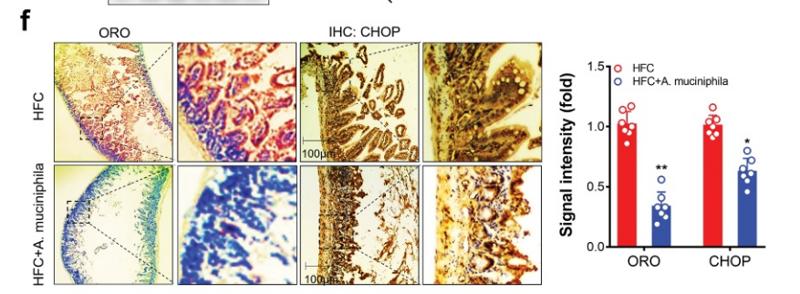
Application: IHC Species: Mice Sample: ileum
Application: WB Species: Human Sample: HaCaT cells
Application: WB Species: Human Sample: HaCaT cells

Application: WB Species: human Sample: MDA-MB-231 cells

Application: WB Species: Human Sample: HepG-2 cells
Application: WB Species: Mice Sample: CD4+ T cells

Application: WB Species: Rat Sample: nigral tissue

Application: WB Species: human Sample: HepG2 cells
Application: WB Species: Human Sample: HepG2 cells
Restrictive clause
Affinity Biosciences tests all products strictly. Citations are provided as a resource for additional applications that have not been validated by Affinity Biosciences. Please choose the appropriate format for each application and consult Materials and Methods sections for additional details about the use of any product in these publications.
For Research Use Only.
Not for use in diagnostic or therapeutic procedures. Not for resale. Not for distribution without written consent. Affinity Biosciences will not be held responsible for patent infringement or other violations that may occur with the use of our products. Affinity Biosciences, Affinity Biosciences Logo and all other trademarks are the property of Affinity Biosciences LTD.