Product: PGC1 alpha Antibody
Catalog: AF5395
Description: Rabbit polyclonal antibody to PGC1 alpha
Application: WB IHC
Cited expt.: WB, IHC
Reactivity: Human, Mouse, Rat
Prediction: Pig, Bovine, Horse, Rabbit, Dog, Chicken, Xenopus
Mol.Wt.: 90~140 kD; 91kD(Calculated).
Uniprot: Q9UBK2
RRID: AB_2837880

View similar products>>

   Size Price Inventory
 100ul $280 In stock
 200ul $350 In stock

Lead Time: Same day delivery

For pricing and ordering contact:
Local distributors

Product Info

Source:
Rabbit
Application:
WB 1:500-1:2000, IHC 1:50-1:200
*The optimal dilutions should be determined by the end user.
*Tips:

WB: For western blot detection of denatured protein samples. IHC: For immunohistochemical detection of paraffin sections (IHC-p) or frozen sections (IHC-f) of tissue samples. IF/ICC: For immunofluorescence detection of cell samples. ELISA(peptide): For ELISA detection of antigenic peptide.

Reactivity:
Human,Mouse,Rat
Prediction:
Pig(100%), Bovine(100%), Horse(100%), Rabbit(100%), Dog(100%), Chicken(100%), Xenopus(80%)
Clonality:
Polyclonal
Specificity:
PGC1 alpha Antibody detects endogenous levels of total PGC1 alpha.
RRID:
AB_2837880
Cite Format: Affinity Biosciences Cat# AF5395, RRID:AB_2837880.
Conjugate:
Unconjugated.
Purification:
The antiserum was purified by peptide affinity chromatography using SulfoLink™ Coupling Resin (Thermo Fisher Scientific).
Storage:
Rabbit IgG in phosphate buffered saline , pH 7.4, 150mM NaCl, 0.02% sodium azide and 50% glycerol. Store at -20 °C. Stable for 12 months from date of receipt.
Alias:

Fold/Unfold

L PGC 1alpha;LEM6;Ligand effect modulator 6;Peroxisome proliferative activated receptor gamma coactivator 1 alpha;Peroxisome proliferative activated receptor gamma coactivator 1;Peroxisome proliferator activated receptor gamma coactivator 1 alpha;Peroxisome proliferator activated receptor gamma coactivator 1 alpha transcript variant B4 3ext;Peroxisome proliferator activated receptor gamma coactivator 1 alpha transcript variant B4 8a;Peroxisome proliferator activated receptor gamma coactivator 1 alpha transcript variant B4;Peroxisome proliferator activated receptor gamma coactivator 1 alpha transcript variant B5;Peroxisome proliferator activated receptor gamma coactivator 1 alpha transcript variant B5 NT;Peroxisome proliferator-activated receptor gamma coactivator 1-alpha;PGC 1 (alpha);PGC 1 alpha;PGC 1v;PGC-1-alpha;PGC1;PGC1(alpha);PGC1A;PGC1v;PPAR gamma coactivator 1 alpha 3 ligand effect modulator 6;PPAR gamma coactivator 1 alpha;PPAR gamma coactivator 1;PPAR gamma coactivator variant form;PPAR-gamma coactivator 1-alpha;PPARGC 1 alpha;PPARGC-1-alpha;PPARGC1;PPARGC1A;PRGC1_HUMAN;

Immunogens

Immunogen:

A synthesized peptide derived from human PGC1 alpha, corresponding to a region within the internal amino acids.

Uniprot:
Gene(ID):
Expression:
Q9UBK2 PRGC1_HUMAN:

Heart, skeletal muscle, liver and kidney. Expressed at lower levels in brain and pancreas and at very low levels in the intestine and white adipose tissue. In skeletal muscle, levels were lower in obese than in lean subjects and fasting induced a 2-fold increase in levels in the skeletal muscle in obese subjects.

Description:
Transcriptional coactivator for steroid receptors and nuclear receptors. Greatly increases the transcriptional activity of PPARG and thyroid hormone receptor on the uncoupling protein promoter. Can regulate key mitochondrial genes that contribute to the program of adaptive thermogenesis.
Sequence:
MAWDMCNQDSESVWSDIECAALVGEDQPLCPDLPELDLSELDVNDLDTDSFLGGLKWCSDQSEIISNQYNNEPSNIFEKIDEENEANLLAVLTETLDSLPVDEDGLPSFDALTDGDVTTDNEASPSSMPDGTPPPQEAEEPSLLKKLLLAPANTQLSYNECSGLSTQNHANHNHRIRTNPAIVKTENSWSNKAKSICQQQKPQRRPCSELLKYLTTNDDPPHTKPTENRNSSRDKCTSKKKSHTQSQSQHLQAKPTTLSLPLTPESPNDPKGSPFENKTIERTLSVELSGTAGLTPPTTPPHKANQDNPFRASPKLKSSCKTVVPPPSKKPRYSESSGTQGNNSTKKGPEQSELYAQLSKSSVLTGGHEERKTKRPSLRLFGDHDYCQSINSKTEILINISQELQDSRQLENKDVSSDWQGQICSSTDSDQCYLRETLEASKQVSPCSTRKQLQDQEIRAELNKHFGHPSQAVFDDEADKTGELRDSDFSNEQFSKLPMFINSGLAMDGLFDDSEDESDKLSYPWDGTQSYSLFNVSPSCSSFNSPCRDSVSPPKSLFSQRPQRMRSRSRSFSRHRSCSRSPYSRSRSRSPGSRSSSRSCYYYESSHYRHRTHRNSPLYVRSRSRSPYSRRPRYDSYEEYQHERLKREEYRREYEKRESERAKQRERQRQKAIEERRVIYVGKIRPDTTRTELRDRFEVFGEIEECTVNLRDDGDSYGFITYRYTCDAFAALENGYTLRRSNETDFELYFCGRKQFFKSNYADLDSNSDDFDPASTKSKYDSLDFDSLLKEAQRSLRR

Predictions

Predictions:

Score>80(red) has high confidence and is suggested to be used for WB detection. *The prediction model is mainly based on the alignment of immunogen sequences, the results are for reference only, not as the basis of quality assurance.

Species
Results
Score
Pig
100
Horse
100
Bovine
100
Dog
100
Chicken
100
Rabbit
100
Xenopus
80
Sheep
0
Zebrafish
0
Model Confidence:
High(score>80) Medium(80>score>50) Low(score<50) No confidence

Research Backgrounds

Function:

Transcriptional coactivator for steroid receptors and nuclear receptors. Greatly increases the transcriptional activity of PPARG and thyroid hormone receptor on the uncoupling protein promoter. Can regulate key mitochondrial genes that contribute to the program of adaptive thermogenesis. Plays an essential role in metabolic reprogramming in response to dietary availability through coordination of the expression of a wide array of genes involved in glucose and fatty acid metabolism. Induces the expression of PERM1 in the skeletal muscle in an ESRRA-dependent manner. Also involved in the integration of the circadian rhythms and energy metabolism. Required for oscillatory expression of clock genes, such as ARNTL/BMAL1 and NR1D1, through the coactivation of RORA and RORC, and metabolic genes, such as PDK4 and PEPCK.

PTMs:

Phosphorylation by AMPK in skeletal muscle increases activation of its own promoter. Phosphorylated by CLK2.

Heavily acetylated by GCN5 and biologically inactive under conditions of high nutrients. Deacetylated by SIRT1 in low nutrients/high NAD conditions.

Ubiquitinated. Ubiquitination by RNF34 induces proteasomal degradation.

Subcellular Location:

Nucleus. Nucleus>PML body.

Nucleus.

Cytoplasm. Nucleus.

Nucleus. Nucleus>PML body.

Nucleus.

Extracellular region or secreted Cytosol Plasma membrane Cytoskeleton Lysosome Endosome Peroxisome ER Golgi apparatus Nucleus Mitochondrion Manual annotation Automatic computational assertionSubcellular location
Tissue Specificity:

Heart, skeletal muscle, liver and kidney. Expressed at lower levels in brain and pancreas and at very low levels in the intestine and white adipose tissue. In skeletal muscle, levels were lower in obese than in lean subjects and fasting induced a 2-fold increase in levels in the skeletal muscle in obese subjects.

Research Fields

· Environmental Information Processing > Signal transduction > AMPK signaling pathway.   (View pathway)

· Environmental Information Processing > Signal transduction > Apelin signaling pathway.   (View pathway)

· Human Diseases > Endocrine and metabolic diseases > Insulin resistance.

· Human Diseases > Neurodegenerative diseases > Huntington's disease.

· Organismal Systems > Aging > Longevity regulating pathway.   (View pathway)

· Organismal Systems > Endocrine system > Insulin signaling pathway.   (View pathway)

· Organismal Systems > Endocrine system > Adipocytokine signaling pathway.

· Organismal Systems > Endocrine system > Glucagon signaling pathway.

References

1). Atomically precise gold nanoclusters as ROS-scavenging clusterzymes to treat high-fat diet-induced obesity. Chemical Engineering Journal, 2024 [IF=13.3]

2). Placenta-specific CYP11A1 overexpression lead to autism-like symptom in offspring with altered steroid hormone biosynthesis in the placenta-brain axis and rescued by vitamin D intervention. Brain, behavior, and immunity, 2024 (PubMed: 39025414) [IF=8.8]

3). m6A methylation-mediated PGC-1α contributes to ferroptosis via regulating GSTK1 in arsenic-induced hepatic insulin resistance. The Science of the total environment, 2023 (PubMed: 37730054) [IF=8.2]

Application: WB    Species: Rat    Sample: livers

Fig. 2. Peroxisome proliferator γ-activated receptor coactivator 1-α (PGC-1α) was involved in NaAsO2-induced hepatic IR and ferroptosis. (A–C) Relative PGC-1α protein and gene expression in rat livers. (D–F) The effect of PGC-1α on total and phosphorylated AKT and GSK3β expression. Cells were transfected with PGC-1α before treatment with 4 μM NaAsO2 for 48 h. Insulin was applied for 10 min before the cells were collected. (G) The effect of PGC-1α on insulin-stimulated glucose uptake. (H–J) The effect of PGC-1α on ACLS4 and GPX4 expression. (K, L) The effect of PGC-1α on Fe2+ was measured by FerroOrange staining (scale bar = 20 μm). (M, N) The effect of PGC-1α on cell lipid reactive oxygen species (ROS) measured with a lipid peroxidation fluorescent probe (scale bar = 20 μm). **P < 0.01 versus the control; #P < 0.05 and ##P < 0.01 versus the NaAsO2 (n = 3).

4). S100A8/A9hi neutrophils induce mitochondrial dysfunction and PANoptosis in endothelial cells via mitochondrial complex I deficiency during sepsis. Cell death & disease, 2024 (PubMed: 38942784) [IF=8.1]

Application: WB    Species: Mouse    Sample: endothelial cells

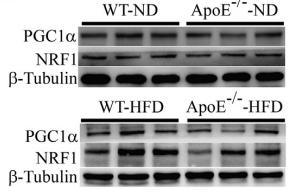
Fig. 3: High expression levels of S100a8/a9 inhibit viability of endothelial cells via induction of metabolic disorders. A Five types of endothelial cells were showed on the UMAP plot; B The sankey diagram showed the percentages of five types of endothelial cells in sham and CLP groups; C. The volcano map showed the noticeably upregulated genes in capillary endothelial cells; D, E The mRNA expression levels of DUSP1 detected by RT-qPCR in cell and animal experiments (n = 6 in each group); F The extent of MAPK negative feedback was evaluated by GSVA enrichment analysis; G Western blot analysis was used to assess Erk signaling pathway in lung tissues from mice (n = 6 in each group); H, I The viability of endothelial cells was evaluated by CCK8 (n = 3 in each group); J The protein expression levels of Erk signaling pathway were assessed by Western blot (n = 6 in each group); K Metabolic pathways in endothelial cells from mice were evaluated by GSVA enrichment analysis; L Heatmap showed the expression levels of mitochondrial complexes-related genes in endothelial cells from mice. M The significantly downregulated cell components were showed on the dot plot; N The protein expression levels of mitochondrial complexes were assessed by Western blot (n = 6 in each group); O Corrplot R package was used to evaluate the correlation between NRF1 and complex I-related genes in every subcluster of endothelial cell; P, Q The mRNA levels of NRF1 and NDUFA3 were measured by RT-qPCR in cell and animal experiments (n = 12 in each group), and the correlation between NRF1 and NDUFA3 was shown on the correlation curve (n = 24). Each bar showed means ± SEM. Unpaired t-test was used for the comparison between two groups. Comparison among three or more groups was analyzed by one-way ANOVA. *p 

5). Polyoxometalates Ameliorate Metabolic Dysfunction-Associated Steatotic Liver Disease by Activating the AMPK Signaling Pathway. International journal of nanomedicine, 2024 (PubMed: 39479173) [IF=8.0]

6). Increased TSPO alleviates neuropathic pain by preventing pyroptosis via the AMPK-PGC-1α pathway. The journal of headache and pain, 2025 (PubMed: 39871133) [IF=7.3]

7). Resveratrol and its derivative pterostilbene attenuate oxidative stress-induced intestinal injury by improving mitochondrial redox homeostasis and function via SIRT1 signaling. Free radical biology & medicine, 2021 (PubMed: 34648904) [IF=7.1]

8). Zinc ions facilitate metabolic bioenergetic recovery post spinal cord injury by activating microglial mitophagy through the STAT3-FOXO3a-SOD2 pathway. Free radical biology & medicine, 2024 (PubMed: 39613048) [IF=7.1]

9). Thiamine Supplementation Alleviates Lipopolysaccharide-Triggered Adaptive Inflammatory Response and Modulates Energy State via Suppression of NFκB/p38 MAPK/AMPK Signaling in Rumen Epithelial Cells of Goats. Antioxidants, 2022 (PubMed: 36290775) [IF=7.0]

Application: WB    Species: Goat    Sample: RECs

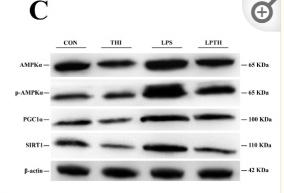
Figure 6 Thiamine (THI) supplementation modulates energy metabolism disturbance induced by lipopolysaccharide (LPS) in RECs. (A) ATP content for different treatments. (B) The expression of AMPKα1, AMPKα2, SIRT1, and PGC1α genes with different treatments. (C) Representative Western blots for AMPKα, phosphorylated AMPKα (p-AMPKα), SIRT1, and PGC1α protein levels with different treatments. (D–G) Immunoblotting and measurement of intensity. Protein levels were normalized to the respective abundance of β-actin. Data are presented as means ± SEM (standard error of the mean), n = 3/group (results representative of at least three independent experiments); CON group, no added LPS or THI; THI group, 5 μg/mL THI; LPS group, 5 μg/mL LPS; LPTH group, 5 μg/mL THI and 5 μg/mL LPS. * denotes p < 0.05, significant difference.

10). Targeting PARK7 Improves Acetaminophen-Induced Acute Liver Injury by Orchestrating Mitochondrial Quality Control and Metabolic Reprogramming. Antioxidants (Basel, Switzerland), 2022 (PubMed: 36358500) [IF=7.0]

Application: WB    Species: Human    Sample: L02 cells

Figure 6. Changes in mitochondrial-related indexes after PARK7 silencing. (A) Changes in mitochondrial synthesis proteins in APAP-treated L02 cells with and without PARK7 silencing and statistical analysis, N = 3. * p < 0.05 vs. ShNC group, ** p < 0.01 vs. ShNC group, # p < 0.05vs. ShNC+APAP group, ## p < 0.01 vs. ShNC+APAP group. (B) WB and statistical analysis of the mitochondrial synthetic proteins PGC-1α, NRF1 and TFAM in the liver tissue of mice with or without APAP intervention with PARK7 knockdown, N = 3, * p < 0.05 vs. WT group, ** p < 0.01 vs. WT group, ## p < 0.01 vs. WT+APAP group. (C,D) Changes in mitochondrial respiratory function and glycolytic function under APAP intervention with or without PARK7 silencing, N = 3. * p < 0.05 vs. shNC group, ** p < 0.01 vs. shNC group, # p < 0.05 vs. shNC+APAP group, ## p < 0.01 vs. shNC+APAP group.

Load more

Restrictive clause


Affinity Biosciences tests all products strictly. Citations are provided as a resource for additional applications that have not been validated by Affinity Biosciences. Please choose the appropriate format for each application and consult Materials and Methods sections for additional details about the use of any product in these publications.

For Research Use Only.
Not for use in diagnostic or therapeutic procedures. Not for resale. Not for distribution without written consent. Affinity Biosciences will not be held responsible for patent infringement or other violations that may occur with the use of our products. Affinity Biosciences, Affinity Biosciences Logo and all other trademarks are the property of Affinity Biosciences LTD.