, blocked with antigen-specific peptides.
Lane 2: 293 cells(uv treatment).
Lane 3: Raji cells.")


, diluted 1/600 was used as secondary antibody.")
 + TGF-β1 (0 ng/mL), corilagin (0 μM) + TGF-β1 (5
ng/mL) and corilagin (25 μM) + TGF-β1 (5 ng/mL) for 12 h. Smad2/3 is shown by green fluorescence and nuclei were stained with DAPI, which emits blue
fluorescence. Scale bars = 50 μm. D. Protein levels of Smad7 examined by western blot assay after HSFs were treated with corilagin for 3 days. GAPDH served as
control. n = 3. E. Protein levels of MMP2, MMP9, MMP13 and TIMP1 in HSFs after treatment with corilagin for 3 days. GAPDH served as control. n = 3. Data are
show as mean ± SD. *p < 0.05, **p < 0.01, ***p < 0.001. (For interpretation of the references to color in this figure legend, the reader is referred to the web version
of this article.)")
 Expression of SMS1 and of (B) E?cadherin and Vimentin were measured by western blotting in MDA?MB?231 cells. (C) Immunofluorescence staining of E?cadherin and of (D) Vimentin by a fluorescence microscope in MDA?MB?231 cells. Magnification, x20. Data are presented as the mean ± standard deviation (n=3). *P<0.05, **P<0.01 vs. the control group; #P<0.05 vs. the TGF?β1 group. SMS, sphingomyelin synthase 1; TGF, transforming growth factor.")
?Expression of TβRI and (B)?phosphorylation of Smad2 and Smad2 were measured by western blotting in MDA?MB?231 cells.")
 CFs were incubated without or with TGF-β1 (10 ng/ml) and
THSWD (15, 30 and 60 μg/ml) for 24 h, and the expression levels of collagen I, collagen III, collagen V, phospho-TGFBR1, TGFBR1, phospho-Smad2, Smad2,
phospho-Smad3 and Smad3 were tested by western blotting. (C–E) Expression levels of collagen I, collagen III and collagen V were normalized with GAPDH (n = 3).
(F–H) Expression levels of phospho-TGFBR1, phospho-Smad2, and phospho-Smad3 were normalized to that of TGFBR1, Smad2 and Smad3 proteins, respectively (n
= 3). Data were shown as mean ± SD. #P < 0.05, vs. control group. *P < 0.05, **P < 0.01, vs. model group.")
 IHC showed inhibition of TGFBR1, Smad3, collagen I, collagen III and α-SMA in THSWD-treated mouse heart tissues compared with the model group. (B–F)
Quantitative analysis for IHC staining of TGFBR1, Smad3, collagen I, collagen III and α-SMA. Data were shown as mean ± SD. **P < 0.01, vs. model group.")
Schematic representation of the mechanism of TGF-β3 in osteogenic differentiation of hPDLSCs. (B)After osteogenic induction of hPDLSCs with various concentrations of TGF-β3 for 7 and 14 d,expression of osteogenic pathway proteins was detected by (B) western blotting and analyzed by grayscale scanning for (C) TGF-βRI, (D) TGF-βRII, (E) t-p38, (F) Pp38, and (G) Runx2 (n = 3). ns means no significant differences, p >0.05 vs. control; *** p < 0.001 vs. control. Abbreviations: TGF-βRI,transforming growth factor-β receptor I; TGF-βRII, transforming growth factor-β receptor II; t-p38,total p38; Pp38, phosphorylated p38; Runx2, runt-related transcription factor 2.")
 the relative expression of TGF‑β/Smad pathway‑related proteins (p‑Smad2 and Smad2) and (B) expression of TβRI.")

 for 48 h before being exposed to H/R. D-F, Western blot analysis for the protein expression of ALK5, Smad2, Smad3, p-Smad2, and Smad3 in the indicated groups and quantitative analysis of ALK5, p-Smad2, and p-Smad3, n = 3.")
 Western blot showed protein expression of TGFBR1 and SMAD3 was upregulated in ectopic endometrial tissue (*, P < 0.05).")
 The total proteins extracted from cells were analyzed for the expression of AKT, ERK and Bax using western blot. The antibodies used were anti-pAKT, anti-AKT, anti-pERK, anti-ERK, anti-Bax and anti-GAPDH. (B) ELISA analysis of TGFβ1 secretion from AsPC-1/vector and AsPC-1/TIPE2 cells. (C) Immunohistochemistry analysis of the TGFβ1 expression in AsPC-1/vector and AsPC-1/TIPE2 tumor tissues. (D) Western blot analysis of the expression of p-TGFBR1 and total TGFBR1 in AsPC-1/vector and AsPC-1/TIPE2 cells. (E) AsPC-1 cells were seeded in 6-well plate and added with or without anti-TGFβ1 antibody or rhTGFβ1 protein. After 48 h incubation, the total proteins extracted from the cultured AsPC-1 cells were analyzed for the expression of AKT and ERK using western blot. The antibodies used were anti-pAKT, anti-AKT, anti-pERK, anti-ERK and anti-GAPDH. Data shown were representative of three independent experiments. Values are presented as means ± SD. ***p < 0.001.")
 the relative expression of TGF-β/Smad pathway-related proteins (p-Smad2 and Smad2) and (B) expression of TβRI. (C) Confocal microscope image for immunofluorescence staining of TβRI. Magnification, ×40 (D) ER stress-related proteins (GRP78 and ATF6) were also detected by western blotting. Values are shown as the mean ± standard deviation (n=3). *P<0.05, **P<0.01 vs. the control group; ##P<0.01 vs. HP-β-CD group; &P<0.05, &&P<0.01 vs. TGF-β1 group. HP-β-CD, hydroxypropyl-β-cyclodextrin; TGF, transforming growth factor; ER, endoplasmic reticulum; GRP78, binding immunoglobulin protein antibody; ATF6, activating transcription factor 6.")

 Percent of CD4+Foxp3+ cells in the colon (A), MLN (B) and spleen (C), respectively. (D-F) Percent of CD4+CD25+ cells in the colon (D), MLN (E), and spleen (F), respectively. (G) Expression of Foxp3, TGFβRII, TGFβRI, and GAPDH in colon assessed by western blot. (H) Relative expression of Foxp3, TGFβRII and TGFβRI, successively. Data are presented as mean ± standard error mean (SEM) (n = 2–5). Here, ***p < 0.001, **p < 0.01, * p < 0.05 vs. control group and ### p < 0.001, ## p < 0.01, # p < 0.05 vs. DSS-treated group.")
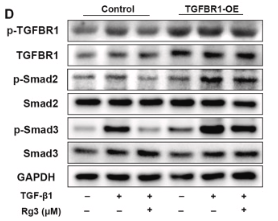
 Forty-eight hours post-infection with negative control Ad-GFP or Ad-TGFBR1, VSMCs were treated with myricetin (60 μM) for 24 h, and western blotting was used to assess pTGFBR1, TGFBR1 and its downstream molecules p-samd3, Smad3, p-Smad2 and Smad2 expression.")
 Western blotting was used to assess p-TGFBR1, TGFBR1 and its downstream molecules psamd3, Smad3, p-Smad2 and Smad2 expression in cells treated with different doses of myricetin for 24 h. (B-G) The densitometry analysis and quantitative results of
(A) (n = 3). Results are shown as mean ± standard deviation (SD). * p < 0.05, ** p < 0.01 compared with the control group.")
 were infected with adenovirus encoding shRNA targeting TFPI2 (TFPI2 shRNA) or overexpressing TFPI2 (TFPI2 OE), followed by stimulation of 5 ng/ml TGF-β2 for 48 h. A, the expression of SMAD7, TGFBR1, TGFBR2, SMAD2/3, and phospho-SMAD2/3 (p-SMAD2/3) was determined by Western blot. Semiquantitative analysis of (B) SMAD7, (C) TGFBR1, and (D) TGFBR2, as well as (E and F) the ratio of p-SMAD2/3 to SMAD2/3. G and H, immunofluorescent staining of SMAD2/3 in hRGECs. Yellow arrows indicated nuclear translocation of SMAD2/3. Data are shown as the mean ± SD (n = 3). ∗p < 0.05, ∗∗p < 0.01, ∗∗∗p < 0.001. TGF-β, transforming growth factor beta; TFP12, tissue factor pathway inhibitor 2.")
 The position of the miR-770–5p target site in the TGFBR1 3’ UTR; Binding sequences between miR-770–5p
and 3’UTR of TGFBR1 were highlighted. (B-C) The dual-luciferase reporter assay was performed to identify the binding between TGFBR1 mRNA and miR-770–5p in
MRC-5 and HEK293T cells. Luciferase activities were calculated as the ratio of firefly/renilla activities and normalized to the TGFBR1-WT + miR-NC group. (D) qRTPCR analysis of TGFBR1 mRNA expression in MRC-5 cells in MRC-5 transfected with 30 nM of miR-NC or miR-770–5p mimic before treated with 5 ng/mL of TGF-β1
for 48 h. (E) Immunofluorescence analysis of TGFBR1 in MRC-5 cells transfected with 30 nM of miR-NC or miR-770–5p mimic before treated with 5 ng/mL of TGF-β1
for 48 h; Red represents TGFBR1 staining; Blue represents nuclear DNA staining by DAPI; Bars = 25 µm. (F) Western blot analysis of TGFBR1 expression in MRC-5
transfected with 30 nM of miR-NC or miR-770–5p mimic before treated with 5 ng/mL of TGF-β1 for 48 h. (G) qRT-PCR analysis of TGFBR1 mRNA expression in lung
tissues of mice exposed to silica. (H) qRT-PCR analysis of TGFBR1 mRNA expression in lung tissues of silicosis patients. All the data are expressed as the means ± SD
of at least 3 independent experiments. *P < 0.05 vs. the control/normal group; #P < 0.05 vs. The TGF-β1 plus miR-NC group.")
 Representative images showing the distribution of PAI-1 in cardiac tissues after immunofluorescence staining. Scar bar = 50 μm. (b, c) Relative mRNA and protein expression of urokinase plasminogen activator (uPA) and tissue-type plasminogen activator (tPA) in the cardiac tissues. (d) Western blot analysis for TGF-β1R, TGF-β1, p-Smad2/3, and Smad2/3. Relative protein expression of (e) PAI-1, (f) TGF-β1R, (g) TGF-β1, (h) p-Smad2/3, and (i) Smad2/3 in the cardiac tissues. Values are expressed as mean ± SD (n = 6). +++p < 0.001vs. sham group. ∗p < 0.05, ∗∗p < 0.01, ∗∗∗p < 0.001vs. MI/R group.")
 MDA-MB-231 cells were treated with various concentration of HP-β-CD (0, 0.6, 0.8, 5 mmol/L). Expression level of TβRI. (B) Confocal microscope image for immunofluorescence staining of TβRI and lipid raft. Magnification, ×400. Analyses for the content of CTxB and TβRI colocalization. The green fluorescence showed the lipid rafts, red fluorescence showed the TβRI. Scale bars represent 40 μm. Data are presented as the mean ± SD (n = 3). ** p < 0.01 versus the control group.")
 MDA-MB-231 cells were treated with various concentration of HP-β-CD (0, 0.6, 0.8, 5 mmol/L). Expression level of TβRI. (B) Confocal microscope image for immunofluorescence staining of TβRI and lipid raft. Magnification, ×400. Analyses for the content of CTxB and TβRI colocalization. The green fluorescence showed the lipid rafts, red fluorescence showed the TβRI. Scale bars represent 40 μm. Data are presented as the mean ± SD (n = 3). ** p < 0.01 versus the control group.")
 Representative immunohistochemical (IHC) staining for TGF-β1, TGFβR1, TGFβR2, pSMAD2, and pSMAD4 in the articular cartilage of the distal femur from control (CONT) and chronic pancreatitis (CP) pigs. Scale bars represent 50 μm. (b) Bar graphs illustrating the optical density (OD) of expression for the analyzed proteins. Measurements were conducted on two histological samples per animal in at least ten randomly selected areas. Bars indicate mean values ± standard error (n = 5 pigs per group). Statistical significance is denoted as * p < 0.05; ** p < 0.01; *** p < 0.001.")
 The expression level of let-7 g in PAECs ;(B) Immunofluorescence double staining of CD31 and α-SMA in RPAECs treated with let-7 g mimic; (C) Immunofluorescence double staining of CD31 and α-SMA in RPAECs treated with let-7 g inhibitor; (D) the potential binding sites of let-7 g to TGFβR1 predicted by Targetscan 7.0 and quantification of the fluorescence intensity in HEK293T cells; (E-F) After transfection of let-7 g mimic or inhibitor, the expression level of TGFβR1 protein in HPAECs; (G) Transfection of after transfection of TGFβR1-Si, the expression levels of CD31, Vimentin and α-SMA were detected by Western blot")
 the relative expression of TGF-β/Smad pathway-related proteins (p-Smad2 and Smad2) and (B) expression of TβRI. (C) Confocal microscope image for immunofluorescence staining of TβRI. Magnification, ×40 (D) ER stress-related proteins (GRP78 and ATF6) were also detected by western blotting. Values are shown as the mean ± standard deviation (n=3). *P")
 Western blot analysis of TGF-β1, TGF-βR1, p-Smad2, Smad2, p-Smad3, and Smad3 protein levels (fold change normalized to GAPDH or total Smad2/3) in lung tissues from sham, COPD, and COPD + OMT mice. (F) Serum TGF-β1 concentration (ng/mL) quantified by ELISA. N = 8 mice/group. (G) TGF-β1 secretion (ng/mL) in HBE cell supernatants after 10% CSE (v/v, 48 h) ± OMT (80 μM, 24-h pretreatment). (H–I) Time-dependent phosphorylation of Smad2/3 (fold change normalized to total Smad2/3) in HBE cells exposed to 10% CSE (v/v, 0–60 min) ± OMT (80 μM, 24-h pretreatment). (J–L) Immunofluorescence staining (scale bar: 50 μm) and quantification of nuclear Smad2/3 intensity (RFU) in HBE cells treated with 10% CSE (v/v, 30 min) ± OMT (80 μM, 24-h pretreatment). N = 3. ###p")
 Schematic diagram of the molecular structure of TF. (B&C) The results of Surface Plasmon Resonance Assay. (D) Computer simulated binding diagram of TF and TβRI. (E&F) The results of Cellular Thermal Shift Assay. Western blot of TβRI decomposition under different conditions. And gray value statistical chart. The above experiments were repeated three times or more, and the data are presented as mean ± SD.")
| Product: | TGFBR1 Antibody |
| Catalog: | AF5347 |
| Description: | Rabbit polyclonal antibody to TGFBR1 |
| Application: | WB IHC IF/ICC |
| Cited expt.: | WB, IHC, IF/ICC |
| Reactivity: | Human, Mouse, Rat |
| Prediction: | Pig, Bovine, Sheep, Rabbit, Dog, Xenopus |
| Mol.Wt.: | 56 kDa(Observed); 56kD(Calculated). |
| Uniprot: | P36897 |
| RRID: | AB_2837832 |
Control Products

Related Downloads
Protocols
Product Info
*The optimal dilutions should be determined by the end user. For optimal experimental results, antibody reuse is not recommended.
*Tips:
WB: For western blot detection of denatured protein samples. IHC: For immunohistochemical detection of paraffin sections (IHC-p) or frozen sections (IHC-f) of tissue samples. IF/ICC: For immunofluorescence detection of cell samples. ELISA(peptide): For ELISA detection of antigenic peptide.
Cite Format: Affinity Biosciences Cat# AF5347, RRID:AB_2837832.
Fold/Unfold
AAT 5; AAT5; Activin A receptor type II like kinase 53kDa; Activin A receptor type II like kinase, 53kD; Activin A receptor type II like protein kinase of 53kD; activin A receptor type II-like kinase, 53kDa; activin A receptor type II-like protein kinase of 53kD; Activin receptor like kinase 5; Activin receptor-like kinase 5; ACVRLK 4; ACVRLK4; ALK 5; ALK-5; ALK5; LDS1A; LDS2A; MSSE; Serine/threonine protein kinase receptor R4; Serine/threonine-protein kinase receptor R4; SKR 4; SKR4; TbetaR I; TbetaR-I; TGF beta receptor type 1; TGF beta receptor type I; TGF beta type I receptor; TGF-beta receptor type I; TGF-beta receptor type-1; TGF-beta type I receptor; TGFBR 1; TGFBR1; TGFBR1 protein; TGFR 1; TGFR-1; TGFR1; TGFR1_HUMAN; Transforming growth factor beta receptor 1; Transforming growth factor beta receptor I (activin A receptor type II like kinase, 53kD); Transforming growth factor beta receptor I; transforming growth factor, beta receptor 1; transforming growth factor, beta receptor I (activin A receptor type II-like kinase, 53kD); Transforming growth factor-beta receptor type I;
Immunogens
A synthesized peptide derived from human TGFBR1, corresponding to a region within the internal amino acids.
Found in all tissues examined, most abundant in placenta and least abundant in brain and heart. Expressed in a variety of cancer cell lines (PubMed:25893292).
- P36897 TGFR1_HUMAN:
- Protein BLAST With
- NCBI/
- ExPASy/
- Uniprot
MEAAVAAPRPRLLLLVLAAAAAAAAALLPGATALQCFCHLCTKDNFTCVTDGLCFVSVTETTDKVIHNSMCIAEIDLIPRDRPFVCAPSSKTGSVTTTYCCNQDHCNKIELPTTVKSSPGLGPVELAAVIAGPVCFVCISLMLMVYICHNRTVIHHRVPNEEDPSLDRPFISEGTTLKDLIYDMTTSGSGSGLPLLVQRTIARTIVLQESIGKGRFGEVWRGKWRGEEVAVKIFSSREERSWFREAEIYQTVMLRHENILGFIAADNKDNGTWTQLWLVSDYHEHGSLFDYLNRYTVTVEGMIKLALSTASGLAHLHMEIVGTQGKPAIAHRDLKSKNILVKKNGTCCIADLGLAVRHDSATDTIDIAPNHRVGTKRYMAPEVLDDSINMKHFESFKRADIYAMGLVFWEIARRCSIGGIHEDYQLPYYDLVPSDPSVEEMRKVVCEQKLRPNIPNRWQSCEALRVMAKIMRECWYANGAARLTALRIKKTLSQLSQQEGIKM
Predictions
Score>80(red) has high confidence and is suggested to be used for WB detection. *The prediction model is mainly based on the alignment of immunogen sequences, the results are for reference only, not as the basis of quality assurance.
High(score>80) Medium(80>score>50) Low(score<50) No confidence
Research Backgrounds
Transmembrane serine/threonine kinase forming with the TGF-beta type II serine/threonine kinase receptor, TGFBR2, the non-promiscuous receptor for the TGF-beta cytokines TGFB1, TGFB2 and TGFB3. Transduces the TGFB1, TGFB2 and TGFB3 signal from the cell surface to the cytoplasm and is thus regulating a plethora of physiological and pathological processes including cell cycle arrest in epithelial and hematopoietic cells, control of mesenchymal cell proliferation and differentiation, wound healing, extracellular matrix production, immunosuppression and carcinogenesis. The formation of the receptor complex composed of 2 TGFBR1 and 2 TGFBR2 molecules symmetrically bound to the cytokine dimer results in the phosphorylation and the activation of TGFBR1 by the constitutively active TGFBR2. Activated TGFBR1 phosphorylates SMAD2 which dissociates from the receptor and interacts with SMAD4. The SMAD2-SMAD4 complex is subsequently translocated to the nucleus where it modulates the transcription of the TGF-beta-regulated genes. This constitutes the canonical SMAD-dependent TGF-beta signaling cascade. Also involved in non-canonical, SMAD-independent TGF-beta signaling pathways. For instance, TGFBR1 induces TRAF6 autoubiquitination which in turn results in MAP3K7 ubiquitination and activation to trigger apoptosis. Also regulates epithelial to mesenchymal transition through a SMAD-independent signaling pathway through PARD6A phosphorylation and activation.
Phosphorylated at basal levels in the absence of ligand. Activated upon phosphorylation by TGFBR2, mainly in the GS domain. Phosphorylation in the GS domain abrogates FKBP1A-binding.
N-Glycosylated.
Ubiquitinated; undergoes ubiquitination catalyzed by several E3 ubiquitin ligases including SMURF1, SMURF2 and NEDD4L2. Results in the proteasomal and/or lysosomal degradation of the receptor thereby negatively regulating its activity. Deubiquitinated by USP15, leading to stabilization of the protein and enhanced TGF-beta signal. Its ubiquitination and proteasome-mediated degradation is negatively regulated by SDCBP.
Cell membrane>Single-pass type I membrane protein. Cell junction>Tight junction. Cell surface. Membrane raft.
Found in all tissues examined, most abundant in placenta and least abundant in brain and heart. Expressed in a variety of cancer cell lines.
Belongs to the protein kinase superfamily. TKL Ser/Thr protein kinase family. TGFB receptor subfamily.
Research Fields
· Cellular Processes > Transport and catabolism > Endocytosis. (View pathway)
· Cellular Processes > Cell growth and death > Cellular senescence. (View pathway)
· Cellular Processes > Cellular community - eukaryotes > Adherens junction. (View pathway)
· Environmental Information Processing > Signal transduction > MAPK signaling pathway. (View pathway)
· Environmental Information Processing > Signaling molecules and interaction > Cytokine-cytokine receptor interaction. (View pathway)
· Environmental Information Processing > Signal transduction > FoxO signaling pathway. (View pathway)
· Environmental Information Processing > Signal transduction > TGF-beta signaling pathway. (View pathway)
· Environmental Information Processing > Signal transduction > Apelin signaling pathway. (View pathway)
· Environmental Information Processing > Signal transduction > Hippo signaling pathway. (View pathway)
· Human Diseases > Infectious diseases: Parasitic > Chagas disease (American trypanosomiasis).
· Human Diseases > Infectious diseases: Viral > Hepatitis B.
· Human Diseases > Infectious diseases: Viral > HTLV-I infection.
· Human Diseases > Cancers: Overview > Pathways in cancer. (View pathway)
· Human Diseases > Cancers: Specific types > Colorectal cancer. (View pathway)
· Human Diseases > Cancers: Specific types > Pancreatic cancer. (View pathway)
· Human Diseases > Cancers: Specific types > Chronic myeloid leukemia. (View pathway)
· Human Diseases > Cancers: Specific types > Hepatocellular carcinoma. (View pathway)
· Human Diseases > Cancers: Specific types > Gastric cancer. (View pathway)
· Organismal Systems > Development > Osteoclast differentiation. (View pathway)
· Organismal Systems > Immune system > Th17 cell differentiation. (View pathway)
· Organismal Systems > Endocrine system > Relaxin signaling pathway.
References

Application: WB Species: human Sample: HK-2 cells
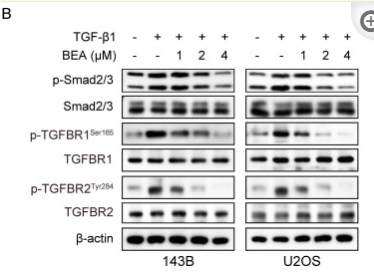
Application: WB Species: Mouse Sample: OS cells

Application: IHC Species: Mouse Sample:
Application: WB Species: Mouse Sample: CFs
Restrictive clause
Affinity Biosciences tests all products strictly. Citations are provided as a resource for additional applications that have not been validated by Affinity Biosciences. Please choose the appropriate format for each application and consult Materials and Methods sections for additional details about the use of any product in these publications.
For Research Use Only.
Not for use in diagnostic or therapeutic procedures. Not for resale. Not for distribution without written consent. Affinity Biosciences will not be held responsible for patent infringement or other violations that may occur with the use of our products. Affinity Biosciences, Affinity Biosciences Logo and all other trademarks are the property of Affinity Biosciences LTD.